In the introduction to this series, I explained what a data library is and how it can help a small data analytics team that lacks formal business intelligence support create a solid foundation for data management. This article will explain the universal principles that should guide the development of a data library.
Let’s Look At The Principles That Will Guide Us In The Development Of A Data Library:
Forward Looking
Automation
Data should be collected and stored in the data library automatically without daily manual intervention. If that is not possible then the collection frequency should be reduced (monthly instead of daily) and a plan for automation created. If the business insists that the data is so important it needs to be refreshed every day then there should be justification for the investment of technology, IT resources, or whatever else would enable automation.
Basic Software Development Principles
Location
Data architecture
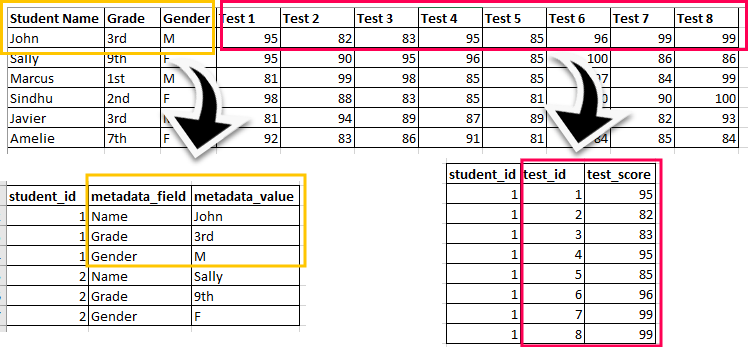
There are wrong ways to structure data in general, such as blank rows between records in a spreadsheet. Then there are many acceptable choices based on preference or circumstance. I believe there is a particular architectural choice that is always possible and avoids many potential problems: Organize tables in a “long” structure with as few columns as possible and separate metadata and metrics.
Consider a source table with data on students: their name, gender, grade, and eight test scores. With the architecture I recommend the first table would store metadata on each student in three columns: student ID, metadata field, and metadata value. This three-column structure can store many categorical columns, and new categories can be added as an append of new rows to the table rather than as the concatenation of a new column. This is incredibly flexible.
Along with that three-column metadata table is a three-column metrics table. Like the metadata table it has an ID column, and then the test identifier (metric name) and test score (metric value). As many metrics as one desires can be stored and like metadata, metrics can be added as a row append rather than a concatenate action.

Besides the architectural advantages this structure can aid with analysis as well. In the example table, it is far easier in most languages and analysis tools to do an average by group than rowwise across many columns.
Readiness
Data from the data library is “ready” to be utilized for reporting, analytics, or whatever the use case(s). The result is there usually should be little effort required to prepare data for new reports and analysis if the source data has been catalogued. If the raw data is not suitable for reporting then there should be either additional table(s) with the restructured data, or scripts/processes that can be applied uniformly on the fly to any subset of the data.
Documentation
There usually should be at least enough info in each of these categories for someone completely unfamiliar with the data to understand:
- What does a column represent
- What is the process for the generation, collection, and cleaning (if applicable) of the data?
- What are the current uses of the data?
This can be done in something as simple as text files or with the aid of a data catalog product.
Standards
Standards should be developed and utilized for things such as column names, visualization colors and file names. This can take the form of a robust style guide or simple rules that are added on an as-needed basis. Certain standards should be used, like column name syntax; others may be in response to confusion from your customers when something has been done in different ways.
Monitor Data Health
The final principle helps to ensure all of this effort does not go for naught. Things will go wrong, for expected and unexpected reasons. It is better to find that out proactively than to be informed by a business partner. Whether you have standard checks or customize them for each data source, ensure you will know at a minimum if automation has failed or data is missing.
In addition to using tools that support these principles an analytics team should choose its tech stack in the context of the particular resources available in its company and team:
Choosing your data library tech stack
- If possible, use tools that are already available at your company. This may be less expensive, avoids bureaucracy, and may allow your IT to better support you.
- Do not try to figure out the perfect long-term solution. What you learn in the first 6-24 months will help you with that, and you’ll be providing value that will help better justify the investment later.
- Take advantages of the skillset your team already possesses; some things will require everyone to use the same method but others can accommodate one’s preferences and/or strengths.
- Be privacy-first in your design. You should be able to document, find, and delete PI systematically and on-demand.
Doing all of this is hard work but it is achievable, and it can be done quickly. In the next article I will give specific examples of how these principles can be implemented.


