As companies continue to grow, making sense of the massive volumes of data they collect over time becomes challenging. Key decision-makers and higher-ups require intelligent data and analytics tools to make informed, profitable decisions.
Business intelligence (BI) tools help companies collect, analyze, monitor and predict all sorts of business scenarios. They do this by identifying trends, providing data visualizations, and offering real-time self-service data analysis that users can base their decisions on.
More specifically, decision-makers can use BI tools to merge and prepare datasets from disparate sources, often unstructured and in different formats. They can then use the tools to visualize insights in interactive, embeddable dashboards. As compared to the older generation of enterprise BI software, new self-service BI makes it easy for IT to set line-of-business users (also known as “”citizen analysts”) up with their own software environments that they can work in on their own.
Users no longer need to have a lot of technical knowledge or the ability to code queries. The key benefit of this is that line-of-business users require minimal IT involvement and they’re able to make informed decisions faster leading to increased profits for the company.
In this article, we’ll take a closer look at some of the best tools for business intelligence and highlight their standout features.
The Sisense business intelligence platform is incredibly user-friendly and requires minimal IT involvement. This makes it the perfect candidate for organizations that have a mix of citizen analysts users and advanced users who’ll need access to it.
Sisense is a scalable solution, which means it’s great for startups, SMBs and enterprise organizations. Users can extend the core software however they’d like, as the platform offers support for a wide variety of add-ons and libraries. In addition, Sisense’s SSO mechanism allows systems to authenticate users without requiring them to enter separate login credentials.
Sisense allows users to consolidate data from various data sources — including Google Analytics, AdWords, and Salesforce — and transform it into interactive visualizations and actionable application components. It also gives users the ability to embed analytics into third-party products with full customizations and white labeling.

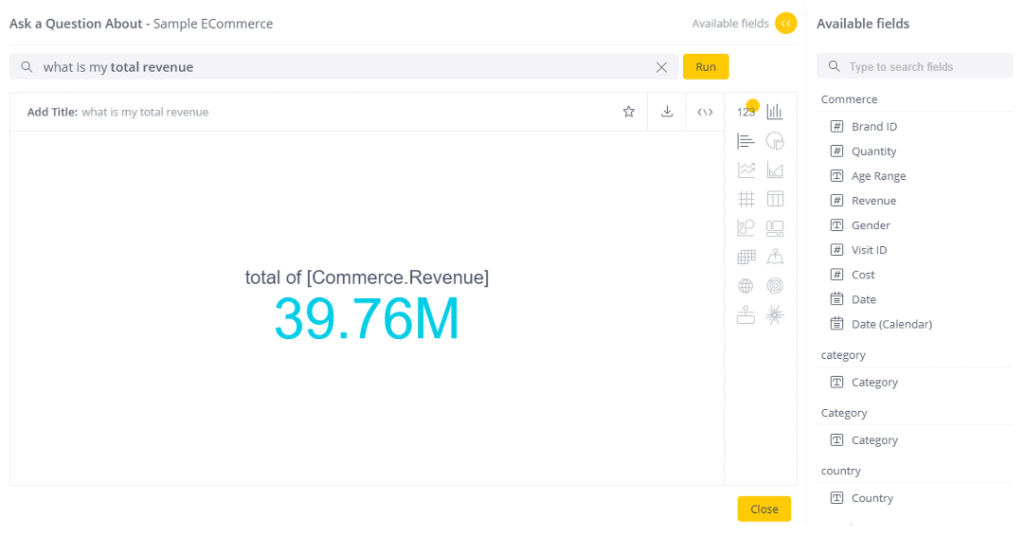
Image via Sisense
One of the most powerful features available with Sisense is its natural language query (NLQ) support, based on NLP technologies. Users can simply ask sophisticated questions and immediately receive data slices and visuals that provide answers to their search query. The platform also provides suggestions as you’re building your query. For example, you can ask What is my total revenue? and quickly see a definitive response. It’s also possible to automate the merging of new data sets and sources, even unstructured ones
Using Sisense, you can create alerts so your stakeholders and data team are immediately notified of anomalies in KPIs. It also lets you integrate and automate alerts into third-party apps including Slack, Zapier and Zendesk to trigger immediate responses. And, finally, you can use Sisense to automate daily, monthly or quarterly reports to send customized snapshots out to key stakeholders on a schedule.
Tableau is a BI tool for data discovery and data visualization that’s great for individual data analysts, teams and organizations. It lets users analyze, visualize and share data helping them make informed business decisions faster. It offers a suite of BI tools including Tableau Desktop, Tableau Online, Tableau Server and Tableau Mobile.
The platform supports connections with a wide variety of data sources both on-prem or in the cloud. This includes SQL databases, big data, spreadsheets, and cloud apps like Google Analytics and Salesforce. Users can access and combine datasets from disparate sources without having to write code. Although Tableau is considered a leader in the self-service BI category, it does require some learning to feel fully at home.
Users can ask questions from published data sources using natural language and get answers in the form of visualizations. Tableau’s end-to-end web authoring capabilities make it easy for users to add additional data sources or create interactive dashboards.
The platform also gives users AI-driven explanations for data points that might otherwise go unnoticed. In addition to this, users can embed interactive dashboards into various third-party apps.
Domo is a cloud-based BI software product that comprises multiple systems giving you the ability to connect multiple data sources (including databases, spreadsheets and social media) and extending them with pre-built apps from the Domo Appstore. The tool is designed with enterprise users in mind, athough it can certainly be used by smaller companies with tech-savvy data teams.
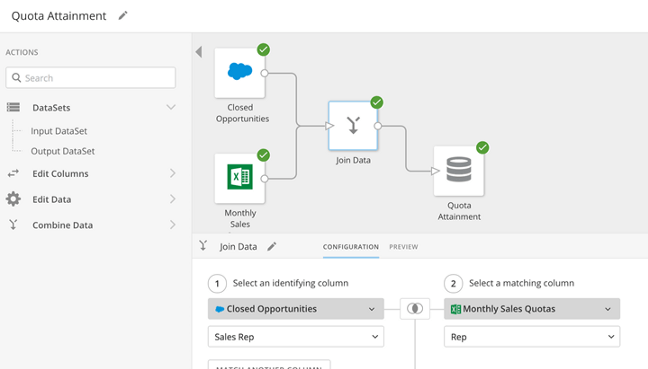
With Domo, users can set up data pipelines with 1,000+ pre-built cloud connectors and query them where they’re hosted. This includes file upload (for example Google Docs or spreadsheets), proprietary systems, and on-premise using Domo Workbench

Image via Domo
The platform also features Magic ETL which lets users leverage data transformations without needing to know SQL. This helps teams speed up data analysis processes. In addition, Domo suggests data visualizations automatically enabling teams to go from raw data sources to graphs, charts, and maps in no time.
Domo also comes with a built-in AI engine, Mr. Roboto, that helps data teams create predictive analysis models and allows them to utilize artificial intelligence and machine learning. For example, users can set this up to alert them whenever there’s a change in KPIs.
Clear Analytics BI is a powerful tool that consolidates data from various business tools such as internal systems, CRMs, cloud apps and accounting software, allowing you to import that data into Excel. The tool works with Microsoft Power BI and is great for users who are proficient with Excel and companies that use Microsoft services.
The standout feature on offer with Clear Analytics BI is that it delivers self-service reports straight to Microsoft Power BI. In addition to this, its integration with Excel enables data analysts to tweak formulas however they’d like and manage user viewing rights.
Clear Analytics BI also offers a full audit trail that lets users trace where the data comes from, which filters were used, when the data was extracted, and who ran the report.
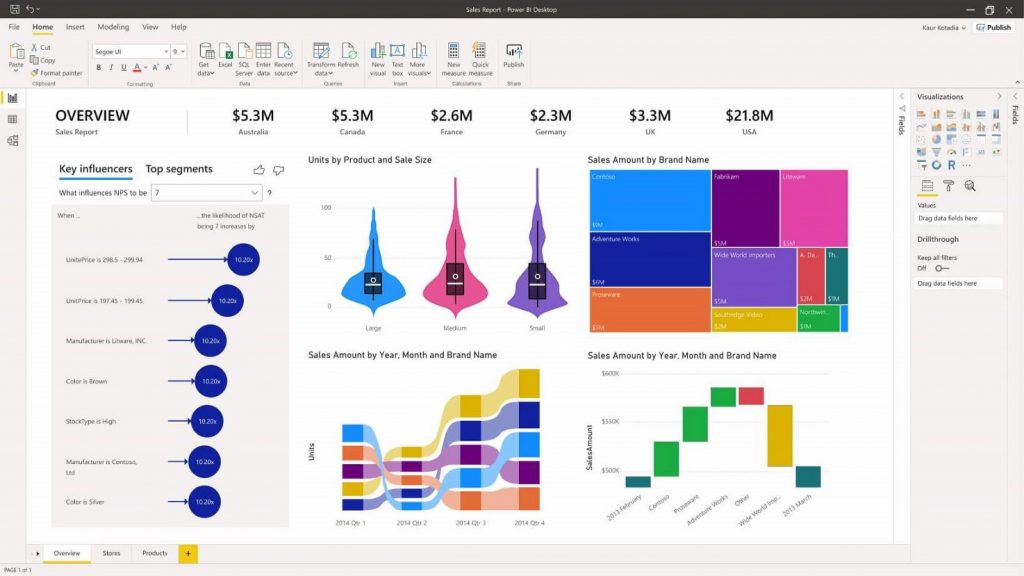
Microsoft Power BI is a web-based business intelligence suite that focuses on providing interactive data visualizations that can be shared across global data centers. It’s designed for enterprise organizations, but it empowers users at every level to make informed decisions.
Microsoft Power BI makes it easy for users to integrate with various third-party apps. For example, users can connect Excel queries, data models and reports to their dashboards in order to gather, analyze and share business data.

Image via Microsoft
The platform integrates seamlessly with Azure data lakes, which makes it easy for users to share large volumes of data with key stakeholders. In addition, they’re able to increase collaboration between departments and effectively reduce the time it takes to get insights.
Microsoft Power BI enables data analysts to prepare data and build machine learning models to gain insights from structured and unstructured data, including text and images. Not to mention, the platform integrates with Power Apps and Power Automate, allowing users to build business applications and automate workflows.
datapine is a BI tool that’s designed for businesses of all sizes across various industries. It’s ideal for both advanced users and average business users. The platform lets users connect data from various data sources, analyze it, create dashboards, and generate reports. datapine offers an SQL mode that empowers users to create custom queries though it also packs a drag-and-drop interface that lets line-of-business users create data visualizations without advanced coding.
The platform also offers powerful analytics features including predictive analysis based on a forecast engine. Users can select KPIs, determine the data points they’d like to forecast, specific previous data points, and define model quality by setting a confidence interval.
In addition, datapine simplifies the data discovery process through neat features like drill-downs, widget linking, and hierarchical filters. It also offers different ways to share reports with team members including via direct URL, providing viewer access, and sending automated emails at specific time intervals
datapine’s AI-based alerts and smart insights alert users in case of anomalies and can also automatically generate different types of insights.
Looker is essentially a data discovery app that’s designed for startups and SMBs. It integrates with just about every SQL database or warehouse — including Redshift, Snowflake and BigQuery — and is amazingly easy to use.
This BI tool offers powerful collaboration features that make it possible for users to share data analytics and reports via email or third-party applications. Users can expect to utilize a multi-cloud strategy that supports multiple data sources and deployment methods.

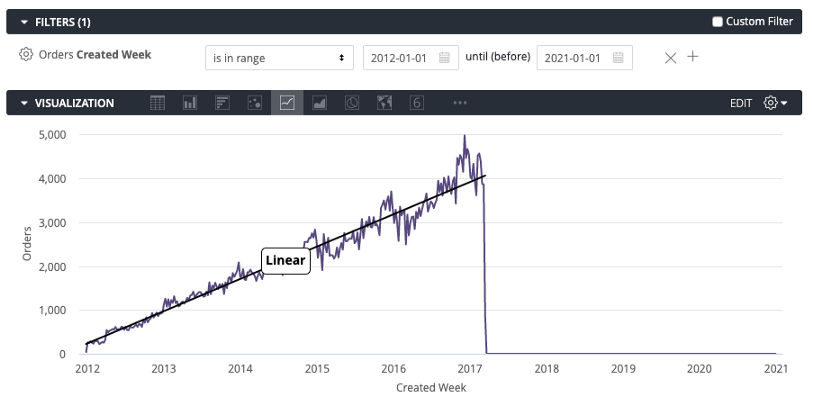
Image via Looker
Looker enables data analysts to see each customer across multiple touchpoints, thereby allowing them to uncover insights based on actual interactions. This is a great way to understand customer usage behavior, create tailored messaging, and identify upselling opportunities to improve business efficiency.
The platform also lets users integrate with tools and apps — including Slack, Segment, Marketo, and Dropbox — to create business intelligence workflows.
Conclusion
BI tools enable key decision-makers, higher-ups, data teams, and stakeholders to better understand large volumes of business data, analyze it and make fast (and profitable) business decisions. New self-service BI tools make it easy for just about everyone in a data team to create and share interactive data visualizations and gain insights faster without having to code.
Do you have experience using BI tools in your organization? If so, which features are most important to you?


