Ready to learn Big Data Analytics? Browse courses like Big Data – What Every Manager Needs to Know developed by industry thought leaders and Experfy in Harvard Innovation Lab.
Three Tips on Surviving the Coming Data Tsunami
We are moving slowly into an era where Big Data is the starting point, not the end. – Pearl Zhu, Digital Master
The year was 1984. Thankfully for the western world the social tremors of the 1950’s never materialized into George Orwell’s Big Brother state, but a different sort of technical tremor was just beginning. It was buried deep underground, and at the time we couldn’t even feel it coming. But it was a tremor that has rapidly developed to the point where we now worry it might overtake us. We call it Big Data. The market intelligence firm IDC calls the sum of all data created the global datasphere. Back in 1984 the planet had roughly 20 million gigabytes (GB)of data stored digitally. Things have changed a lot since then.
In 2010 the global datasphere was roughly 4 zettabytes (ZB). A zettabyte is 1 trillion gigabytes, or equal to the storage capacity of almost 4 billion iPhones (256GB model). If you look at the chart below, you’ll see that it’s going to take just a few more years for the datasphere to reach more than 50ZB. You’d need more than 207 billion iPhones to store all that data.
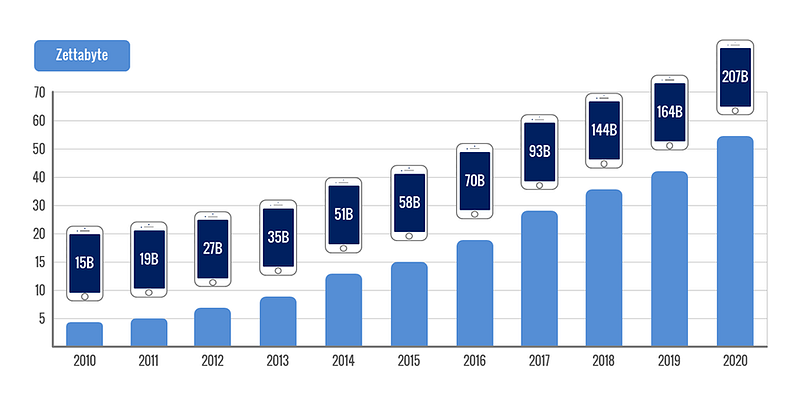
We call this “big” data because it’s impossible for humans to work directly with the volume and scale of it all, and we require machines to do much of the processing and analysis.
Creative professions — and by that I mean any profession that creates something, be it design, software engineering, media, finance, construction, the list goes on — already are, or soon will be, inundated with data.
If you’re a creative professional and struggled just trying to get your head around the scale of the numbers I described above I have some bad news for you: we’re just getting started.
Projections are that by 2025 the datasphere will triple in size to almost 160ZB. That means not only is the amount of data we’re creating growing, but the rate of growth in both data creation and network traffic are accelerating. There’s no avoiding it either. Data is permeating every industry as we move beyond just PCs and mobile devices to ubiquitous sensors everywhere, persistently generating and transmitting data. This is the ubiquitous “edge” being discussed by the tech cognoscenti. Already, the Internet of Things (IoT) is putting data generating sensors on what were traditionally “dumb” objects. Here are just a few:
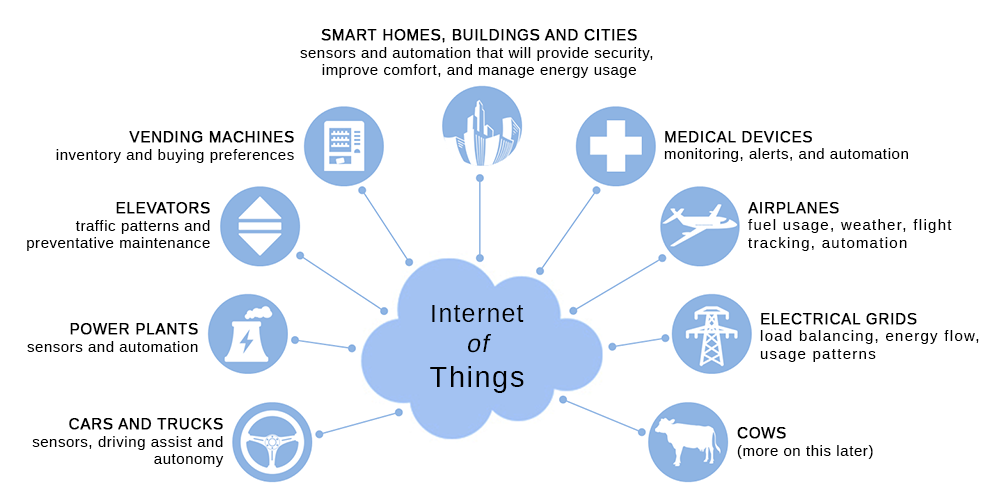
This list is just a small sample, but even if we take everything that is happening in the IoT today, it will be dwarfed by what we’ll see in the next decade and beyond.
Intelligent Everything
I was having coffee with some friends recently. The coffee shop had a device that supports NFC payments — I could tap my phone on the device, and it would charge my credit card. If you’ve used Apple Pay or Android Pay, you’ve done the same thing, and that’s an example of IoT in action.
What was even more interesting though is that this coffee shop also had “smart tables.” I was able to make my purchase at a kiosk (an early form of smart menu, if you will), and one of the last steps is to take a “table tracker,” a device that looked rather like a thick plastic drink coaster with a number on it and clearly some electronics built in (it had a small LED glowing green). I brought the tracker over to the table, which also had a number on it. The table, which also has some electronics built in, “knows” what trackers are on it and communicates both the table and tracker numbers to the staff.
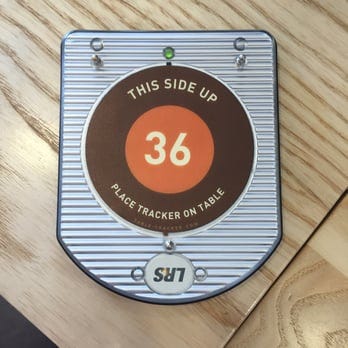
Table Tracker
When my drink was ready, someone brought it right over to where I was sitting, even though up to this point I had never spoken to any of the staff. As we drank our coffee and pondered the future of this technology, it was rather easy to see that this is just the beginning.
Eventually the table will talk to the glasses and plates as well, knowing, for example, when my glass is empty and prompting an offer for a refill.
When we’re done, we’ll be able to pay, securely, right at the table. And all this doesn’t consider how IoT might be involved in making reservations, coordinating with friends, and transporting everyone there. At the coffee shop, maybe humans will be involved in preparing and serving food and drinks, or maybe much of it will be automated, but there is little question in my mind that the industry will get there, and probably in the not too distant future.
The data that will need to be collected, transmitted and processed to make all that happen is orders of magnitude more than is required by the restaurant business today, and it all must be done in a way that’s profitable to the restaurant, while maximizing customer enjoyment, privacy, and security. It’s a tall order (perhaps even a disruptive one,) but those businesses that don’t keep up will be left behind as the modern restaurant experience becomes more enjoyable for customers and more profitable for those that innovate.
How Can You Keep Up?
Maybe you’re a designer or a factory manager or a lawyer. You create physical objects or work with intellectual property or provide services to other humans. One thing you are not, though, is an expert in data, let alone big data. But the fact is that the average (or even above average) professional even in fields that are not related to data engineering or data science will still need to participate in this immensely data rich world. It will be expected that your decisions will be “data driven” (see my thoughts on that here), and that you’ll use data to help you and those you work with understand your business and your customers.
But how does the non-data scientist deal with the massive amount of data available and the increasing complexity of effectively making sense of it? I want to be clear here that there is a lot of technical complexity to dealing with big data. It must be captured and stored. And there is the querying and modelling that must be done to get any use out of it. That’s why we have data scientists and engineers.
Here are three tips for learning to survive in—and succeed in—the coming world of big data. I hope they will help you adapt what to expect from data professionals and to get better at asking the right questions.
1. Make the Big Smaller
Big data, as the term implies, is too high in both volume and complexity for most human minds to manage effectively. Humans are predisposed to fear outsized challenges, seeing them more as threats than opportunities. Like the Big Bad Wolf, Big Foot, or Big Brother, big data for many fits squarely in the realm of a large, misunderstood entity they must either conquer or be consumed by. One way to deal with obstacles that are too big is by reducing their size. More specifically, we can reduce the size we have to deal with directly. With big data I don’t mean that you’d look to reduce the overall volume or complexity. Rather you would reduce the set of that data you need to process. There are a couple effective ways to do this. One is to ask questions, and the other is to focus the data. They are related, so let’s look at both of them.
Ask Questions
The idea here is that you want to get really clear about what questions you want the data to try and answer. Put another way, ask what problem are you trying to solve. The grid below shows a series of number. This is just data and without any questions to answers it doesn’t really tell us much of anything.
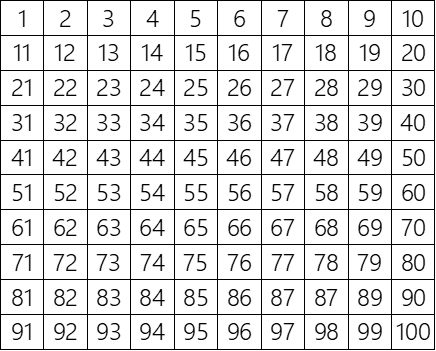
To help make the data in this grid smaller, we can start asking questions such as:
- What is the highest number in the grid?
- How many rows are there?
- How many columns?
- What is the sum of the first horizontal row?
- What is the most common number that appears in the four center squares?
You get the idea. The questions drastically reduce the need to be concerned with all the data and help us start to think about what we’re really after. That helps reduce the size of the data considerably, but we can make the data even smaller by focusing even further.
Focus the Data
One way we can focus even further is to be very specific about what we expect the data to predict. What I mean by that is that you can develop a hypothesis and use the data to test that hypothesis. For example, say you develop a product you expect will be used primarily by 25–35 year old females without children. By “primarily” you mean over 60%. Of all the data you might have about your product — how much it sells for, where it’s selling, how often it’s used, etc., the one piece of data you need to test your hypothesis is age and gender of customers. If you find that your customers are more that 60% 45–55 year old males, that gives you valuable information either about your product or about your assumptions about your customers, or both, but doesn’t require you to look at all the data you have about your product.
Looking back at our number grid, let’s say our hypothesis is that the grid represents a sequential list of numbers from 1 to 100. Now use the data to test that hypothesis.

You’ll notice that the question you’re trying to answer allows you to be very focused on how you’re looking at the data. Because of that focus, you likely were able to spot the part of the grid that invalidates the hypothesis pretty quickly.

While deep focus helps in many situations, broad focus can also be an effective way to deal with big data. We do this by looking for trends or patterns.
2. Look for Patterns
Another approach is to take a big step back from all the detail and instead look for patterns at a broader level. In truth, all the detail is still needed, but with big data tools are involved in helping spot the patterns. Sometimes that tool is something relatively simple like Excel. Other times (and increasingly more often) it requires something more, like sophisticated data models and machine learning (ML) algorithms. The data to feed those algorithms can come from anywhere. Like cows, for example.
I recently heard of a farm that began using IoT devices on their cattle. The problem they were trying to solve was about knowing when a cow was ready to give birth.
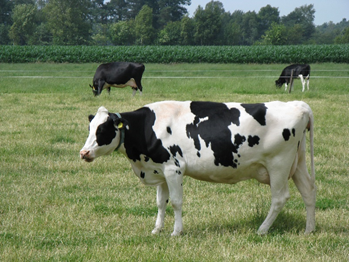
The typical farm cow requires help from the farmer to ensure successful delivery and care of the calf. The “low tech” way to do this is that when a farmer believes the cow is ready to give birth, he or she must physically monitor the cow, waiting for signs that the cow is about to deliver. Researchers noticed however, that in the minutes before delivery a cow will swing her tail in a unique way. This gave them the clue they needed. The solution was to attach a sensor to the cow’s tail, sending data back to a service that could process the data, watching for the telltale swinging. Once the pattern is detected, the farmer can be alerted, and be there just when the calf is delivered. The data solution here involves big data — there’s a lot of information being sent by the sensor on the cow’s tail that would be a real challenge for a human to process and make sense of. But none of it is relevant until a specific pattern occurs, only then does the data become critically important and the software can do the right thing. Knowing what pattern to look for is key to making this work.
3. Play
Play might sound a bit trite when we’re talking about massive amounts of important data, but it’s not as strange as it might seem. When we play as children we take our imagination and let it run wild. We create characters, stories, and entire worlds, and there are no boundaries beyond what we can imagine. As adults, play can be just as powerful, if perhaps more directed. Thinking through possibilities beyond the obvious is a critical part of innovation and learning. Another word for play might be experimentation, but I use play here because the word “experiment” can sound overly formal and scientific, and that is not always what’s required. Play is an important tool the big data toolbox. This is especially valuable when the problem is ambiguous, or the possible solutions are complex. The process is relatively straightforward. If you have a problem with many possible solutions you would:
- Develop ideas of what some of the results may be
- Design contests to test each one in isolation
- Gather scores on each contest
- Look at the results and pick the winner(s)
Kind of sounds like a game, doesn’t it? While it can (and should be) fun, it’s also serious business. That becomes clear if you substitute a few words above:
ideas = theories
contests = experiments
results = solutions
scores = data
It’s important to recognize here that there is a real science to designing good experiments and correctly evaluating the results, often requiring expertise in mathematics and statistics. But there is real value for decision makers to play with the ideas first, reducing the problem down to smaller bits rather than trying to process everything at once. Let’s look at the process above with an example.
Suppose you work in operations at a trucking company. You are tasked with finding ways to improve fuel economy across the fleet. Since the company has already tackled the “low hanging fruit” by purchasing the most fuel-efficient trucks, your job is to find other ways to optimize. There are many things you could look at:
- Driving habits, including starts and stops, average speed, etc.
- Routes taken to common destinations
- Times of day trucks are on the road
- Type of fuel used
- Types of tires used
- Average weight of each truck
The most likely outcome is that improving fuel economy would require adjustments to most or all of these, but the data needed to evaluate the whole solution would be very big indeed. The way to tackle the problem is to experiment, or “play” with the variables. The variables are kind of like Lego bricks. You mix and match until you find what works. From the list above, let’s use the hypothesis that tires might contribute to fuel efficiency. To test that you’d want to single out tires as a variable, and you might do that using the following process:
- Trucks using current tires would be the control group
- You’d take a small set of trucks and try a different set of tires
- You’d compare gas mileage over a period of time between the two sets and see which performs better against your stated goal of better fuel economy
Repeat this until you’ve tested all desired tire options
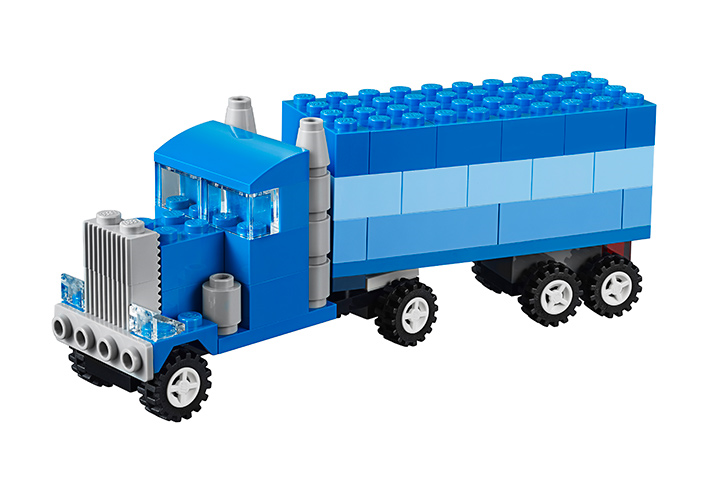
Play can be a powerful tool for adults, too
This simple example hides some of the complexity in correctly executing the experiment — you must account for variability in things like drivers, weather, routes, etc. — but the point in focusing on a single variable is that you’d end up with data related to only that variable, tires, and you’d have a good idea how much tire options contribute to the fuel economy problem. If you did the same with your other hypotheses, you would end up with an assessment of each hypothesis, and its relative contribution to your overall solution. So our list above might now look like the following:
Total Fuel Savings: 25%
- Driving habits improvements: 3%
- Route optimization: 6%
- Time optimization: 2%
- Type of fuel used: 4%
- Types of tires used: 3%
- Average weight of each truck: 7%
This result allows the company to make better decisions about where to start, and what to expect from each change. The big data problem got a lot more manageable.
Be Prepared, Big Data Will Get a Lot Bigger
Big data is, or soon will be, a reality in professional life for the vast majority of people in the modern economy. Here I’ve explored just three strategies you can use to help yourself be successful in that world. There are many more, and I’ll share more of them soon here on Medium. 1984 wasn’t just the year of Big Brother, it was the underwater tremor of what would—by 2017 —become an earthquake of data. The tsunami is on its way.
To survive and even thrive, we must understand what we need from the data,develop techniques to focus our questions, and experiment with the variables. With the right approach, we can harness the power of the data tsunami and make it a powerful force for ourselves and our work.


