Situation – Companies often complain about involuntary attrition. This translates into the ballooning cost associated with losing talent. Hiring an individual from a top university or a company does not guarantee retention. If talent is not compatible with the organizational culture, processes or business, it translates into tension, job dissatisfaction, estranged relationship and ultimately attrition.
Complication – It is often said that the first step of talent management is to focus on recruitment. If you bring the best talent, you get the best return on your investment. However, we all know best talents do not guarantee retention. In fact, the best talent is of little use if it is not compatible with your organizational culture.
This is because organizational culture is formed by people who love to be in their job and the people around them. So we hear two words here “Job” and “People.” If we want people to stay, we have to provide them with compatible jobs and people around them.
The million-dollar question is how?
Solution – The solution starts by following a well thought out and data science-driven approach to screen candidates. Is it possible to procure a crystal ball to predict whether a candidate you are interviewing is likely to stay a certain number of years? The answer is yes, you can. However, such predictive capability requires first digging the gold mine of data at your disposal.
Your existing data can help you find if a candidate is likely to stay in the organization or not.
Here is the proposed solution.
The easily available data source for present and past candidates (many of them would be present and past employees) is their resumes. In a social media-driven world like ours, we can easily pull information about their skills as well. In case an organization has a database system in place, the same set of information can be easily translated into a dataset by requesting candidates fill an online form on the career section of the company website.
Information like the number of years of education, number of organizations worked for, number of positions held in the past, and age can be easily translated to a score for every employee. Let’s call this the “Employee Score”.
Besides this vital data, organizations collect more data regarding their people. This includes but is not limited to:
- Performance Management
- Employee Engagement
- Learning and Development
- Rewards and Recognition
- Number of hours worked, benefits exercised etc.
How it works?
Now we have two sets of information.
- Data Set 1 – Information gathered from an employee CV
- Data Set 2 – Past and present data of employees who have stayed in the organization for over a year.
What this employee score would tell us?
This employee score would include employee demographics like age, number of years of experience, number of organizations worked, etc. This will be compared against the employee’s number of years of service with the current organization. This analysis will help us cluster employees who have stayed with the organization for over a year.
So with this Employee Scoring method, every candidate’s CV can be tested and before even interviewing we can assess if this candidate is suited for the organization or not.
How to implement this solution? (Check some Dummy Matrices on next page)
For this solution, it is important to have a repository of past data. For organizations that have a structured data management system, it would be a lot easier for them to implement. However, the beauty of the solution lies in its simplicity. This solution indeed is simple. If an organization does not have a data management system in place, mere paper data like CVs of previous employees etc. can be used.
Since the use of social media is prevalent, past employee CVs can be downloaded from social media websites.
Business Value – Maximum
Cost of Implementation – Minimum
Here are some Dummy Matrices
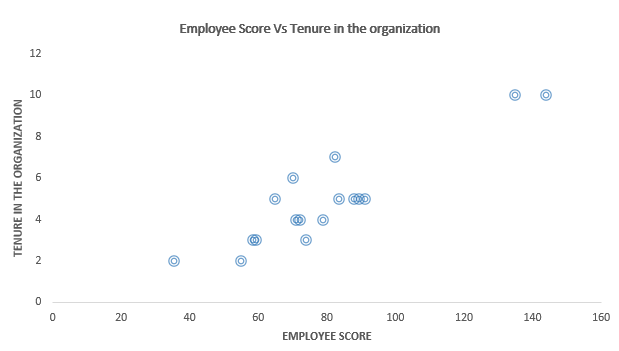
Employee Score Vs Tenure in the Organization


This matrix can be used by different geographies/departments or age groups. Correlations can be tested at different designations etc. Quite likely, there is a strong correlation
Besides Employee Score, its component like “Education Score” can be used to build some interesting matrices. See if employees with high education scores have low/high attrition at different levels/designations. At the initial stage of the career, employees with high education scores might look for opportunities quickly compared to a later stage of their career where they look for stability. To me, it means organizations should hire employees with low education scores and train them internally to have high retention and ROI on their learning and development efforts.
Overall Employee Score, Work Experience Score and Education Score can be used to explore various interesting and valuable matrices to know your employees and translate that into some best practices to shortlist CVs.
A note on Employee Score:-
Employee score is comprised of the following:-
- Education Score
- Work Experience Score**
This would first require setting rules of the game according to the business. For example, if you have a small organization, you might prefer the candidate to have experience working in a small organization as well. To do that an HR can put weights on the size of the organization. Those weights can be added to the tenure across all the organizations a candidate has worked for.
Here is a quick look at the Employee Score Methodology
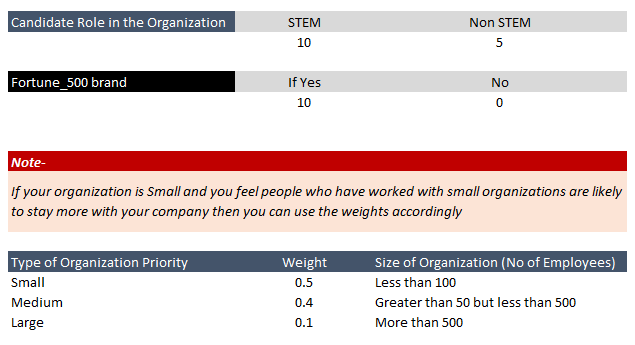
Education Score:-Let’s define certain mapping data tables regarding different education backgrounds. The easiest one is categorizing it as STEM and Non STEM background. (Please note that organizations can get into the details of the area of specialization at the University/College level and choose score according to their preference)

*Professional certification programs like SAS, R, etc. can be given some scores too, depending on the type of role an organization is hiring for.
Figure 1 – Defined scores across different levels of education and degrees.
Education Score = School Score + Bachelor’s (Area of Specialization) Score + Bachelor’s (Degree/Diploma/Certificate) Score + Master’s (Area of Specialization) Score + Master’s (Degree/Diploma/Certificate) Score + M. Phil Score + PHD Score – – – – – – – – – – – (1)
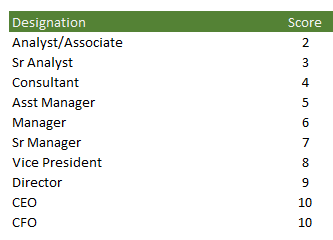
Work Experience/Career Score: – This score is comprised of designation held by an individual, Tenure in the organizations, Work experience gained by type of organization, Type of role played in the organizations worked, Industry organization belonged to and size of organization.
In some cases organizations may include some weight for competitors, fortune vs non fortune 500 company etc.


**Special Note on Weighted Score as used in calculating work experience score.
Organizations may prioritize the work experience of an individual. For example, if organization A is Small and looking for an individual who has experience working in a small set-up, then they can prioritize it by providing appropriate weight. Here is an example of calculation: – (Count of the organization by type) *(Weight as defined in the table) (See Figure 2.).

Calculation of Work Experience Score = Total Year of Experience (Sum of tenure in all organizations * Total Weighted Organization Score). – – – – – – – – – – – – (2)
Employee Score = (1) + (2)
HR Professionals may try many other matrices like Employee Score Vs Engagement score across different demographics like Age, Location, a number of years of education etc. All those are insightful and very unique findings to use in a recruiting decision.


