Ready to learn Data Science? Browse Data Science Training and Certification courses developed by industry thought leaders and Experfy in Harvard Innovation Lab.
Real world problems solved with Math
Every day you test ideas, recipes, new routes so you can get to your destination faster or with less traffic … The important question, however, it was that idea/recipe/route significantly better than your previous one?
It's Friday night and you want to watch a movie. There are three movies that caught your eye, but you're not really sure if they're good or not. In this modern day and age, you're that kind of person that still relies on family and friends for recommendations. So, you ask them to rate those movies and get ready to crunch the data.
The beauty of dummy data
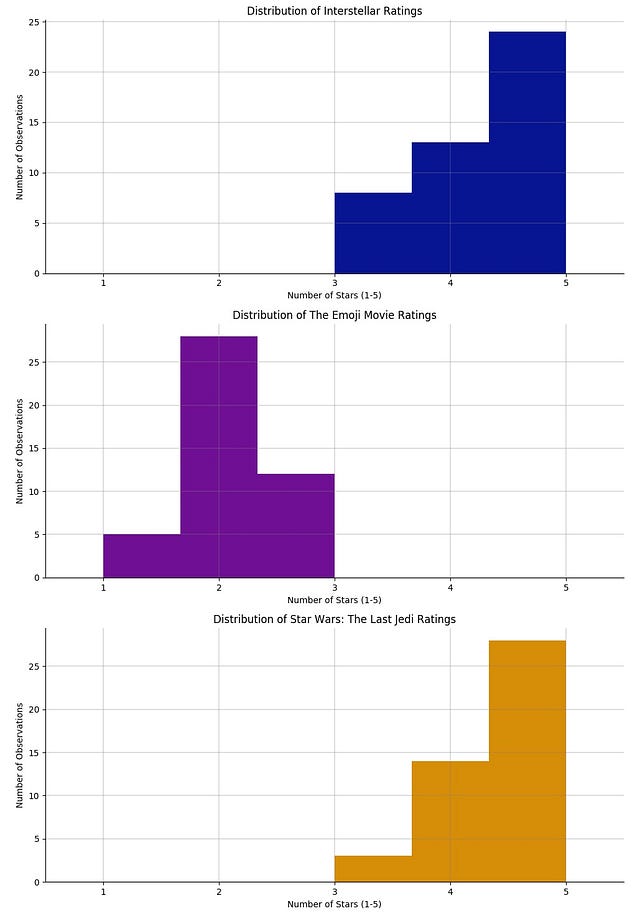
Even though it looks like your friends are somewhat skeptical about The Emoji Movie, you need to examine each rating distribution in order to understand more about the central trend of your friends' votes.
Ratings for Interstellar
- median — the centre of the distribution — of 5 units;
- mean of ~4.35 units;
- standard deviation — how far apart the values are from the median — of ~0.76 units;
Ratings for The Emoji Movie have
- median of 2 units;
- mean of ~2.2 units;
- standard deviation of ~0.59 units;
Ratings for Star Wars: The Last Jedi have
- median of 5 units;
- mean of ~4.5 units;
- standard deviation of ~0.62 units;
This is great! But actually it doesn't tell you much more than what you already knew: The Emoji Movie might not be that appealing, and there's a clear competition between Interstellar and Star Wars …
To clear out any questions about which movie your friends rated as best, you decide to run some statistical tests and compare the three rating distributions.
Hypothesis Testing
Hypothesis Tests, or Statistical Hypothesis Testing, is a technique used to compare two datasets or a sample from a dataset. It is a statistical inference method so, in the end of the test, you'll draw a conclusion — you'll infer something — about the characteristics of what you're comparing.
In the case of your Friday night movie choice, you want to pick a movie that is the best choice among your three possibilities.
What kind of test should you use?
In order to answer this question, first, you need to know what distribution it follows. Because the different tests assume that data follows a specific distribution.
You already calculated a few statistics the ratings data — mean, median and standard deviation — but what shape does your data take?
One of the most famous distributions is the so called Bell Curve, the Normal Distribution. In this distribution, the data is centered at the mean, which you can identify by the peak of the bell curve. In this case, it also corresponds to the value in the middle, the median.
The data points in a Normal Distribution are spread around the mean/median according to the standard deviation.
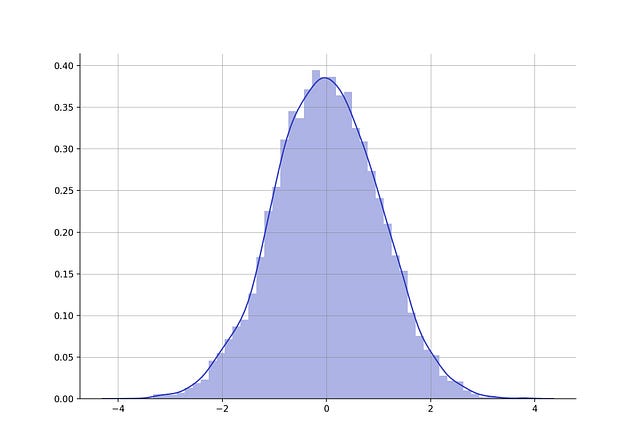
Example of a dataset that follows a Normal Distribution with mean 0 and standard deviation of 1
In this example of a Normal Distribution, it's easy to see that most values are centered around zero — the mean and median of the distribution — and that sides of the curve are moving away from the mean in increments of 1 unit.
Do the movie ratings follow a Normal Distribution?
Thankfully, Statisticians have thought about identifying the shape of your data. They created an easy way to figure that out: the Quantile-Quantile Plot, a.k.a., Q-Q Plot.
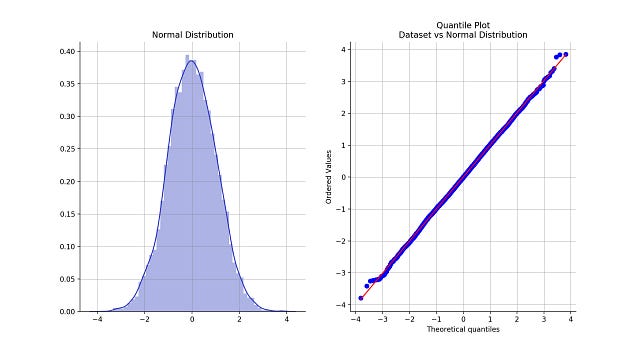
A dataset that follows a Normal Distribution and the Q-Q plot that compares it with the Normal Distribution
Q-Q plots help visualize the quantiles of two probability distributions against one another. Quantiles are simply a way of saying that you are dividing the distribution into equal parts. For instance, quartiles, divide a distribution into quarters, 4 equal parts.
How to read this Q-Q Plot?
In the example above we already knew the dataset followed a Normal Distribution.
What the Q-Q plot intends to visually represent is that, if both datasets follow the same distribution, they'll roughly be aligned along the diagonal red line. The more the blue dots, corresponding to your dataset, deviate from the diagonal line, corresponding to the distribution to compare to, the bigger the difference between the two distributions.
So, to figure out what kind of distribution each movie rating dataset follows you can compare them with a Normal Distribution using a Q-Q plot.
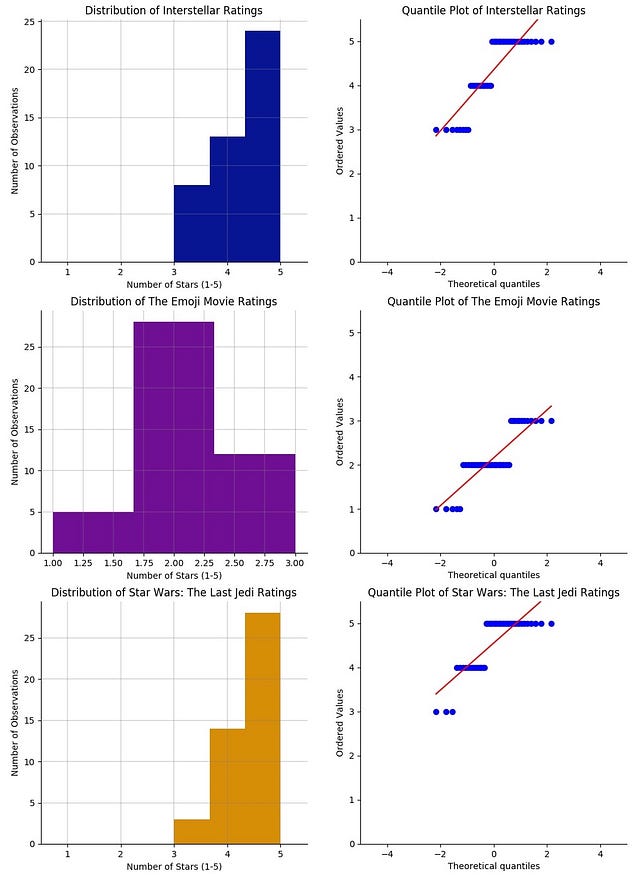
Distribution of each movie rating and corresponding Q-Q plot vs Normal Distribution
The first thing that may come to mind is This doesn't look at all like the Q-Q plot I was expecting! Well, sort of.
The data points are distributed along the diagonal line however, the reason why it doesn't follow the red line entirely is because the ratings are discrete values instead of continuous. That's why we see, for instance, in the Star Wars ratings a few blue dots horizontally aligned with the value 4 and on top of the red line and then, further up, a few more dots aligned with value 5.
So you can prove that it follows a Normal Distribution because, although in a discrete, step-wise way, the data follows the diagonal line.
Now that you figured out that your ratings follow a Normal Distribution, it's time to pick a statistical test.
Not quite yet.
Before even thinking about what test you are going to use, you need to
- Define your hypothesis;
- Set the significance level of the statistical test.
Then you're good to pick the statistical test!
1. Defining Your Hypothesis
A hypothesis test is usually composed by
- Null Hypothesis (H0, read "H zero"): states that all things remain equal. No phenomena are observed or there is no relationship between what you are comparing;
- Alternative Hypothesis (H1, read “H one”): states the opposite of the Null Hypothesis. That there was some change or observed relationship between what you are comparing
For you Friday movie night, what you really want to know is if one movie is significantly better than the others. In this case, you can build your hypothesis on the difference between the average rating your friends gave to each movie.
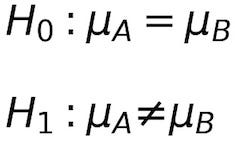
Which you can read as Null Hypothesis (H0): The mean of movie A is equal to the mean of movie B and Alternative Hypothesis (H1): The mean of movie A is not equal to the mean of movie B.
2. Set the Significance Level of the Statistical Test
The goal of the statistical test is to try to prove that there is an observable phenomenon.
The goal of the statistical test is to try to Reject the Null Hypothesis, which states there's no observable change or behaviour
It could be either proving a treatment that shows improvement in patient health, a sample that has characteristics of a larger population or two datasets that are considered different, i.e., they couldn't have been drawn from the same population. So, at the end of the test, you want to be confident about rejecting the Null Hypothesis.
This leads to defining the significance level of the test.
Described as a probability, and represented by the Greek letter alpha, it specifies the probability of rejecting the Null Hypothesis when it was actually true, i.e., you couldn't observe the phenomenon or change in question.
I think about the significance level as setting a standard of quality for your test, in order to be able to draw accurate conclusions.
In your Friday night movie quest, not identifying a good movie to watch has very minimal consequences: some potentially wasted time, and a bit of frustration. But you can see the importance of setting the appropriate significance level in scenarios like clinical trials, where you're testing a new drug or treatment.
The significance levels that are normally used are 1% and 5%.
For this movie night pick, we can settle at 5%, i.e., alpha = 0.05.
What Statistical Test To Use?
Knowing that the data follows a Normal Distribution and that you want to compare the means of your friends'ratings, one particular statistical test comes to mind.
This statistical test is normally used to verify if there is a significant difference between two datasets. And, as I mentioned earlier, first you have to guarantee that both datasets have the following characteristics
- Follow a Normal Distribution;
- Are independent of each other.
Let’s assume your friends weren’t biased when they rated each movie, in order to attribute a completely independent rating.
From what we've seen so far, you're good to use Student's t-Test!
In order to verify if one of the movies is significantly better than the other, you can conduct an independent two-sample t-test. This test will also have to be a two-tailed test because we’re trying to capture a general significant difference, either lower or higher. Think about the “tails” of the Normal Distribution plot.
Ready to run the t-test? Wait, not yet!
All your friends rated the different movies, however, as you verified earlier, each movie rating distribution has a different standard deviation. This means that each distribution has a different variance.
Because the variance of the distributions is not the same, you have to use instead of a slightly different test, Welch’s t-Test.
This is also called the unequal variances t-test. It’s an adaptation of Student’s t-Test and still requires the data to be normally distributed. However, it takes into account both variances when computing the test.
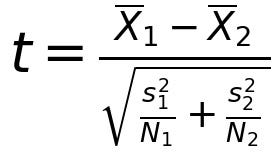
The numerator accounts for the difference between the two means, represented by X1 and X2, while the denominator takes into account the variance, represented by s and the size of each dataset N.
In the Friday night movie example, the size of the dataset is going to be the same for both movies, because all your friends rate all three movies. But with Welch's t-test, we make sure that the variance of each rating distribution is factored in when verifying if there is a significant difference between ratings.
With the Welch’s t-Test, and for each for each pair of distributions, you calculate the test statistic, which every statistical software generates once you run the test.
Now, the significance level comes back to action, because you’re ready to draw a conclusion about the data.
Alongside the test statistic, your software of choice will also provide you with the p-value. Also expressed as a probability, the p-value is the probability of observing a value as extreme as the test statistic, given that the Null Hypothesis is true.
In this Friday movie night scenario, the p-value would be the probability of having a mean rating so much higher or so lower than the one we’re comparing to.
You have all the pieces of the puzzle now!
You ran the test, got the test statistic and the p-value and now you can use the p-value and the significance level to determine if there’s a statistically significant difference between the dataset.
Crunching all the data with the statistical software of your choice you get the following results
Interstellar vs The Emoji Movie
- Test-Statistic ~= 15.07
- p-value = 1.833202972237421e-25
The Emoji Movie vs Star Wars: The Last Jedi
- Test-Statistic ~= -18.54
- p-value = 3.4074007278724943e-32
Looking at the absolute value of the test-statistics above, given that they're so large, you can conclude that there's significant difference between the two pairs movies.
Comparing the significance level with each p-value, you can safely reject the Null Hypothesis, which states that there's no difference between the mean rating of these movies.
This applies to both Interstellar vs The Emoji Movie and The Emoji Movie vs Star Wars: The Last Jedi, because in both cases the p-value is much smaller than the significance level of 0.05 we set before running the test.
You just concluded that there’s actually a significant difference between the average rating of The Emoji Movie (2.2 units) compared with both Interstellar (4.35 units) and Star Wars (4.5 units).
Given that the average rating of the latter movies is significantly higher you can safely exclude The Emoji Movie from your candidate list.
Now there are only two contestants left …
Interstellar vs Star Wars: The Last Jedi
- Test-Statistic ~=-1.35
- p-value = 0.18046156732197555
From these results, you can't prove that there is a statistically significant difference between these two movies. If you recall, their average rating is very close — 4.35 compared to 4.5 units.
Even though it's tempting to say the Null Hypothesis is true, and that there is no difference between the two means, you can't.
What you can say is that you don't have enough empirical evidence to reject the Null Hypothesis.
If you want to abide by the Statistics rules, you'd have a technical tie
As a tie-breaker, you could ask the opinion of an unbiased third-party or just watch the one that has the highest average rating.


