Can these libraries really process bigger than memory datasets or is it all just a sales slogan?
This intrigued meto make a practical experiment with Dask and Vaex and try to process a bigger than memory dataset. The dataset was so big that you cannot even open it with pandas.
What do I mean by Big Data?
Big Data is a loosely defined term, which has as many definitions as there are hits on Google. In this article, I use the term to describe a dataset that is so big that we need specialized software to process it. With Big, I am referring to “bigger than the main memory on a single machine”.
Definition from Wikipedia:
Big data is a field that treats ways to analyze, systematically extract information from, or otherwise, deal with data sets that are too large or complex to be dealt with by traditional data-processing application software.
What are Dask and Vaex?

Dask provides advanced parallelism for analytics, enabling performance at scale for the tools you love. This includes numpy, pandas and sklearn. It is open-source and freely available. It uses existing Python APIs and data structures to make it easy to switch between Dask-powered equivalents.
Vaex is a high-performance Python library for lazy Out-of-Core DataFrames (similar to Pandas), to visualize and explore big tabular datasets. It can calculate basic statistics for more than a billion rows per second. It supports multiple visualizations allowing interactive exploration of big data.
Dask and Vaex Dataframes are not fully compatible with Pandas Dataframes but some most common “data wrangling” operations are supported by both tools. Dask is more focused on scaling the code to compute clusters, while Vaex makes it easier to work with large datasets on a single machine.
The Experiment

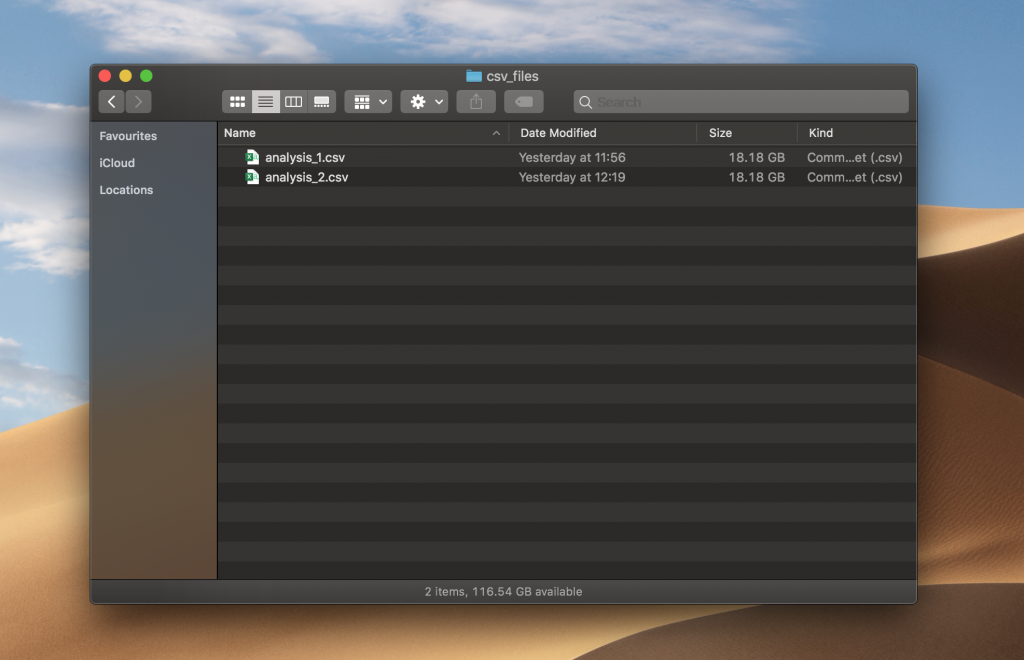
I’ve generated two CSV files with 1 million rows and 1000 columns. The size of a file was 18.18 GB, which is 36.36 GB combined. Files have random numbers from a Uniform distribution between 0 and 100.

import pandas as pd
import numpy as npfrom os import pathn_rows = 1_000_000
n_cols = 1000for i in range(1, 3):
    filename = 'analysis_%d.csv' % i
    file_path = path.join('csv_files', filename)
    df = pd.DataFrame(np.random.uniform(0, 100, size=(n_rows, n_cols)), columns=['col%d' % i for i in range(n_cols)])
    print('Saving', file_path)
    df.to_csv(file_path, index=False)df.head()

The experiment was run on a MacBook Pro with 32 GB of main memory — quite a beast. When testing the limits of a pandas Dataframe, I surprisingly found out that reaching a Memory Error on such a machine is quite a challenge!
macOS starts dumping data from the main memory to SSD when the memory is running near its capacity. The upper limit for pandas Dataframe was 100 GB of free disk space on the machine.
When your Mac needs memory it will push something that isn’t currently being used into a swapfile for temporary storage. When it needs access again, it will read the data from the swap file and back into memory.
I’ve spent some time thinking about how should I address this issue so that the experiment would be fair. The first idea that came to my mind was to disable swapping so that each library would have only the main memory available — good luck with that on macOS. After spending a few hours I wasn’t able to disable swapping.
The second idea was to use a brute force approach. I’ve filled the SSD to its full capacity so that the operating system couldn’t use swap as there was no free space left on the device.

This worked! pandas couldn’t read two 18 GB files and Jupyter Kernel crashed.
If I would perform this experiment again I would create a virtual machine with less memory. That way it would be easier to show the limits of these tools.
Can Dask or Vaex help us and process these large files? Which one is faster? Let’s find out.
Vaex vs Dask

When designing the experiment, I thought about basic operations when performing Data Analysis, like grouping, filtering and visualizing data. I came up with the following operations:
- calculating 10th quantile of a column,
- adding a new column,
- filtering by column,
- grouping by column and aggregating,
- visualizing a column.
All of the above operations perform a calculation using a single column, eg:
# filtering with a single column
df[df.col2 > 10]
So I was intrigued to try an operation, which requires all data to be processed:
- calculate the sum of all of the columns.
This can be achieved by breaking down the calculation to smaller chunks. Eg. reading each column separately and calculating the sum and in the last step calculating the overall sum. These types of computational problems are known as Embarrassingly parallel — no effort is required to separate the problem into separate tasks.
Vaex

Let’s start with Vaex. The experiment was designed in a way that follows best practices for each tool — this is using binary format HDF5 for Vaex. So we need to convert CSV files to HDF5 format (The Hierarchical Data Format version 5).
import glob
import vaexcsv_files = glob.glob('csv_files/*.csv')for i, csv_file in enumerate(csv_files, 1):
    for j, dv in enumerate(vaex.from_csv(csv_file, chunk_size=5_000_000), 1):
        print('Exporting %d %s to hdf5 part %d' % (i, csv_file, j))
        dv.export_hdf5(f'hdf5_files/analysis_{i:02}_{j:02}.hdf5')
Vaex needed 405 seconds to covert two CSV files (36.36 GB) to two HDF5 files, which have 16 GB combined. Conversion from text to binary format reduced the file size.
Open HDF5 dataset with Vaex:
dv = vaex.open('hdf5_files/*.hdf5')
Vaex needed 1218 seconds to read the HDF5 files. I expected it to be faster as Vaex claims near-instant opening of files in binary format.
Opening such data is instantenous regardless of the file size on disk: Vaex will just memory-map the data instead of reading it in memory. This is the optimal way of working with large datasets that are larger than available RAM.
Display head with Vaex:
dv.head()
Vaex needed 1189 seconds to display head. I am not sure why displaying the first 5 rows of each column took so long.
Calculate 10th quantile with Vaex:
Note, Vaex has percentile_approx function which calculates an approximation of quantile.
quantile = dv.percentile_approx('col1', 10)
Vaex needed 0 seconds to calculate the approximation of the 10th quantile for the col1 column.
Add a new column with Vaex:
dv[‘col1_binary’] = dv.col1 > dv.percentile_approx(‘col1’, 10)
Vaex has a concept of virtual columns, which stores an expression as a column. It does not take up any memory and is computed on the fly when needed. A virtual column is treated just like a normal column. As expected Vaex needed 0 seconds to execute the command above.
Filter data with Vaex:
Vaex has a concept of selections, which I didn’t use as Dask doesn’t support selections, which would make the experiment unfair. The filter below is similar to filtering with pandas, except that Vaex does not copy the data.
dv = dv[dv.col2 > 10]
Vaex needed 0 seconds to execute the filter above.
Grouping and aggregating data with Vaex:
The command below is slightly different from pandas as it combines grouping and aggregation. The command groups the data by col1_binary and calculate the mean for col3:
group_res = dv.groupby(by=dv.col1_binary, agg={'col3_mean': vaex.agg.mean('col3')})

Vaex needed 0 seconds to execute the command above.
Visualize the histogram:
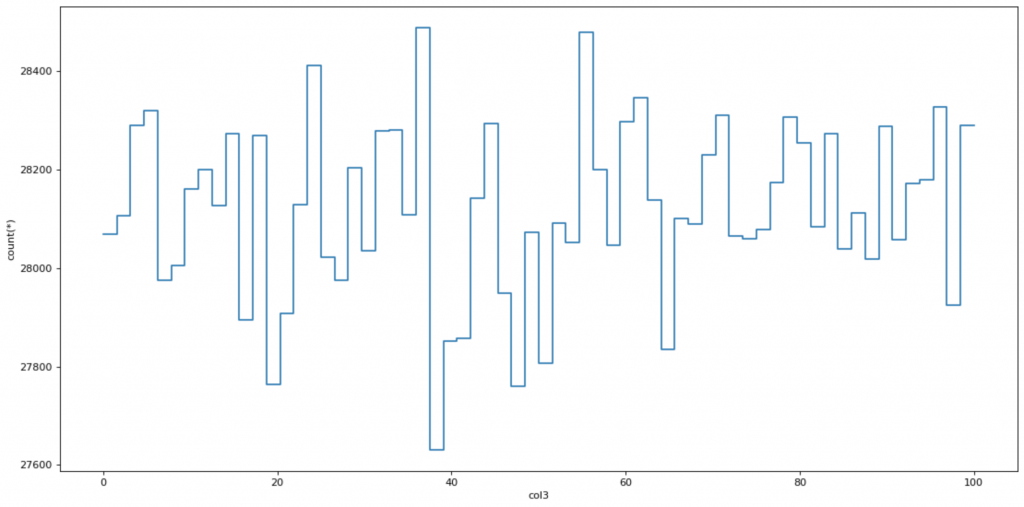
Visualization with bigger datasets is problematic as traditional tools for data analysis are not optimized to handle them. Let’s try if we can make a histogram of col3 with Vaex.
plot = dv.plot1d(dv.col3, what='count(*)', limits=[0, 100])

Vaex needed 0 seconds to display the plot, which was surprisingly fast.
Calculate the sum of all columns
Memory is not an issue when processing a single column at a time. Let’s try to calculate the sum of all the numbers in the dataset with Vaex.
suma = np.sum(dv.sum(dv.column_names))
Vaex needed 40 seconds to calculate the sum of all columns.
Dask

Now, let’s repeat the operations above but with Dask. The Jupyter Kernel was restarted before running Dask commands.
Instead of reading CSV files directly with Dask’s read_csv function, we convert the CSV files to HDF5 to make the experiment fair.
import dask.dataframe as ddds = dd.read_csv('csv_files/*.csv')
ds.to_hdf('hdf5_files_dask/analysis_01_01.hdf5', key='table')
Dask needed 763 seconds for conversion. Let me know in the comments if there is a faster way to convert the data with Dask. I tried to read the HDF5 files that were converted with Vaex with no luck.
HDF5 is a popular choice for Pandas users with high performance needs. We encourage Dask DataFrame users to store and load data using Parquet instead.
Open HDF5 dataset with Dask:
import dask.dataframe as ddds = dd.read_csv('csv_files/*.csv')
Dask needed 0 seconds to open the HDF5 file. This is because I didn’t explicitly run the compute command, which would actually read the file.
Display head with Dask:
ds.head()
Dask needed 9 seconds to output the first 5 rows of the file.
Calculate the 10th quantile with Dask:
Dask has a quantile function, which calculates actual quantile, not an approximation.
quantile = ds.col1.quantile(0.1).compute()
Dask wasn’t able to calculate quantile as Juptyter Kernel crashed.
Define a new column with Dask:
The function below uses the quantile function to define a new binary column. Dask wasn’t able to calculate it because it uses quantile.
ds['col1_binary'] = ds.col1 > ds.col1.quantile(0.1)
Filter data with Dask:
ds = ds[(ds.col2 > 10)]
The command above needed 0 seconds to execute as Dask uses the delayed execution paradigm.
Grouping and aggregating data with Dask:
group_res = ds.groupby('col1_binary').col3.mean().compute()
Dask wasn’t able to group and aggregate the data.
Visualize the histogram of col3:
plot = ds.col3.compute().plot.hist(bins=64, ylim=(13900, 14400))
Dask wasn’t able to visualize the data.
Calculate the sum of all columns:
suma = ds.sum().sum().compute()
Dask wasn’t able to sum all the data.
Results
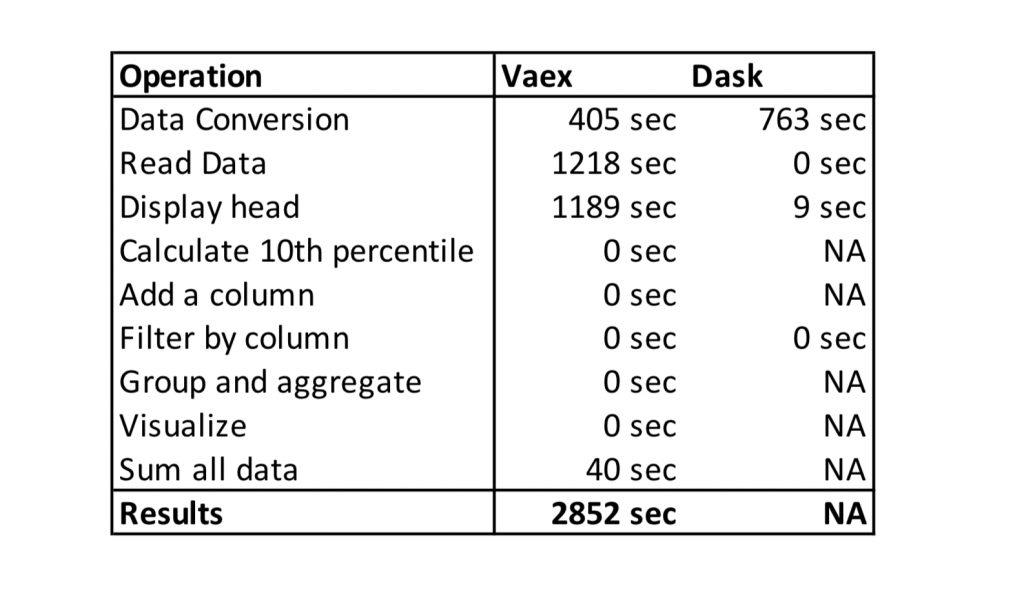
The table below shows the execution times of the Vaex vs Dask experiment. NA means that the tool couldn’t process the data and Jupyter Kernel crashed.

Conclusion

Vaex requires conversion of CSV to HDF5 format, which doesn’t bother me as you can go to lunch, come back and the data will be converted. I also understand that in harsh conditions (like in the experiment) with little or no main memory reading data will take longer.
What I don’t understand is the time that Vaex needed to display the head of the file (1189 seconds for the first 5 rows!). Other operations in Vaex are heavily optimized, which enables us to do interactive data analysis on bigger than main memory datasets.
I kinda expected the problems with Dask as it is more optimized for compute clusters instead of a single machine. Dask is built on top of pandas, which means that operations that are slow in pandas, stay slow in Dask.
The winner of the experiment is clear. Vaex was able to process bigger than the main memory file on a laptop while Dask couldn’t. This experiment is specific as I am testing performance on a single machine, not a compute cluster.


