A Visual Guide to Standard Procedures in Data Science
Let’s suppose that you’ve been given a data problem to solve and you’re expected to produce unique insights from the data given to you. So the question is, what do you exactly do to transform a data problem through to completion and generate data-driven insights? And most importantly of all, Where do you start?
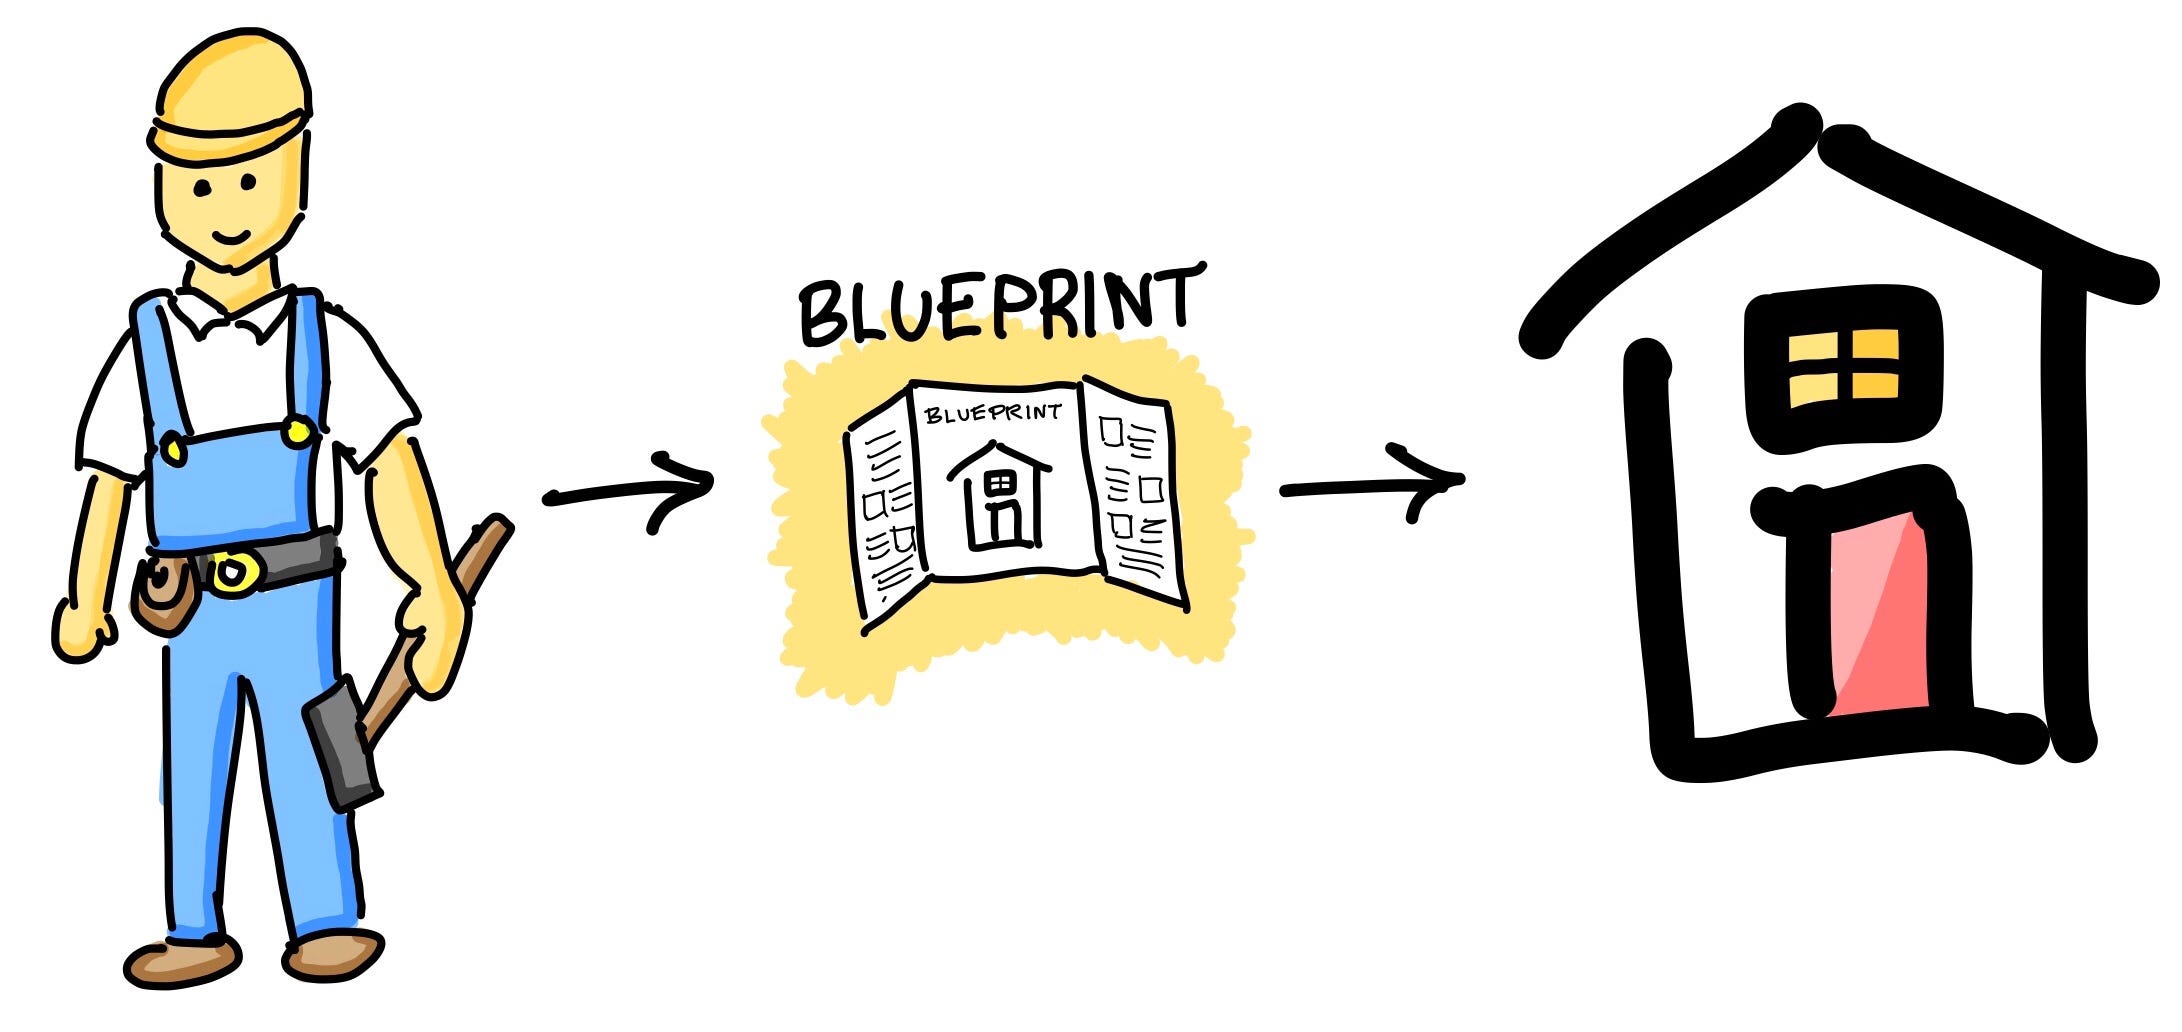
Let’s use some analogy here, in the construction of a house or building the guiding piece of information used is the blueprint. So what sorts of information are contained within these blueprints? Information pertaining to the building infrastructure, the layout and exact dimensions of each room, the location of water pipes and electrical wires, etc.
Continuing from where we left off earlier, so where do we start when given a data problem? That is where the Data Science Process comes in. As will be discussed in the forthcoming sections of this article, the data science process provides a systematic approach for tackling a data problem. By following through on these recommended guidelines, you will be able to make use of a tried-and-true workflow in approaching data science projects. So without further ado, let’s get started!
Data Science Life Cycle
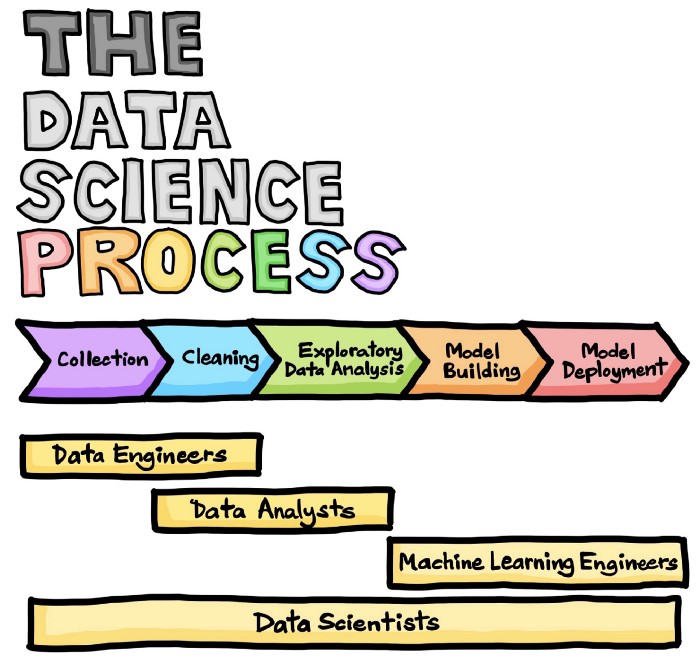
The data science life cycle is essentially comprised of data collection, data cleaning, exploratory data analysis, model building and model deployment. For more information, please check out the excellent video by Ken Jee on the Different Data Science Roles Explained (by a Data Scientist). A summary infographic of this life cycle is shown below:

Such a process or workflow of drawing insights from data is best described by CRISP-DM and OSEMN. It should be noted that both are comprised of essentially the same core concepts while each framework was released at different time. Particularly, CRISP-DM was released at a time (1996) when data mining has started to gain traction and was missing a standard protocol for carrying out data mining tasks in a robust manner. Fourteen years later (2010), the OSEMN framework was introduced and it summarizes the key tasks of a data scientist.
Personally, having started my own journey into the world of data in 2004 and the field was known back then as Data Mining. Much of the emphasis at the time was placed in translating data to knowledge where another common term that is also used to refer to data mining is Knowledge Discovery in Data.
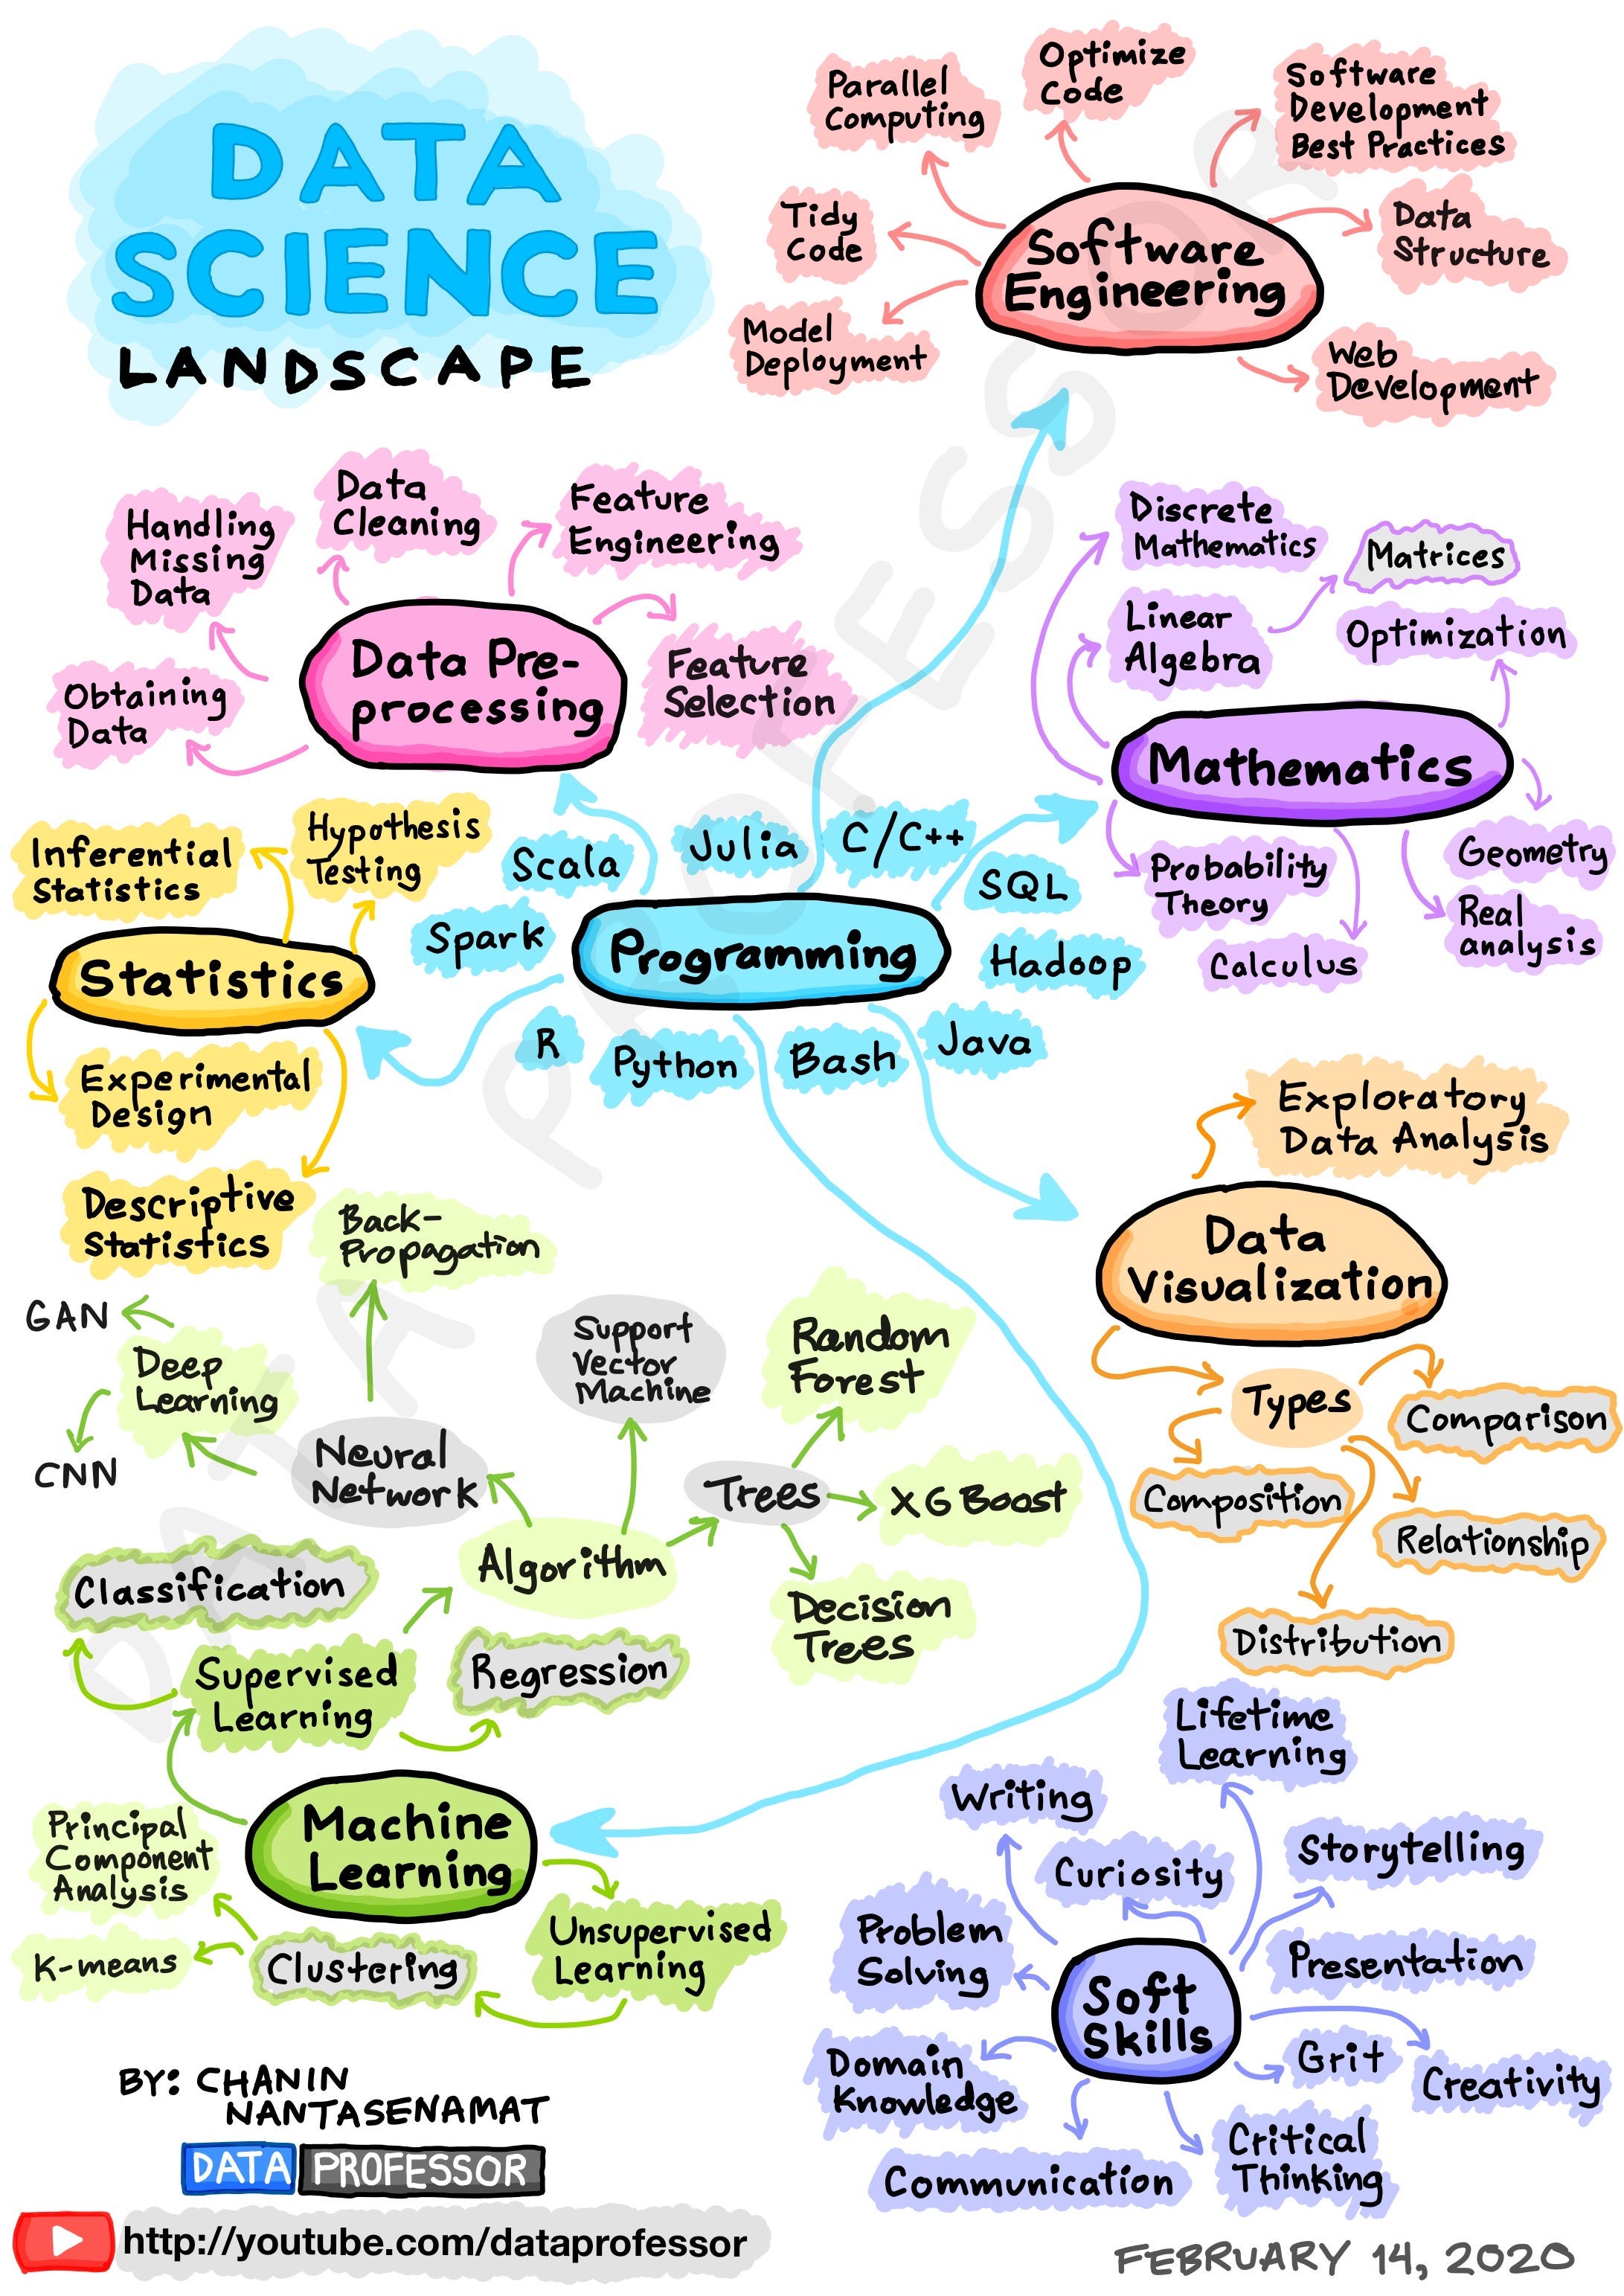
Over the years, the field has matured and evolved to encompass other skillsets that led to the eventual coining of the term Data Science that goes beyond merely building models but also encompasses other skillsets both technical and soft skills. Previously, I have drawn an infographic that summarizes these 8 essential skillsets of data science as shown below. Also check out the accompanying YouTube video on How to Become a Data Scientist (Learning Path and Skill Sets Needed).
CRISP-DM
The acronym CRISP-DM stands for Cross Industry Standard Process for Data Mining and CRISP-DM was introduced in 1996 in efforts to standardize the process of data mining (also referred to as knowledge discovery in data) such that it can serve as a standard and reliable workflow that can be adopted and applied in various industry. Such standard process would serve as a “best practice” that boasts several benefits.
Aside from providing a reliable and consistent of process by which to follow in carrying out data mining projects but it would also instill confidence to customers and stakeholders who are looking to adopt data mining in their organizations.
It should be noted that back in 1996, data mining had just started to gain mainstream attention and was at the early phases and the formulation of a standard process would help to lay the solid foundation and groundwork for early adopters. A more in-depth historical look of CRISP-DM is provided in the article by Wirth and Hipp (2000).
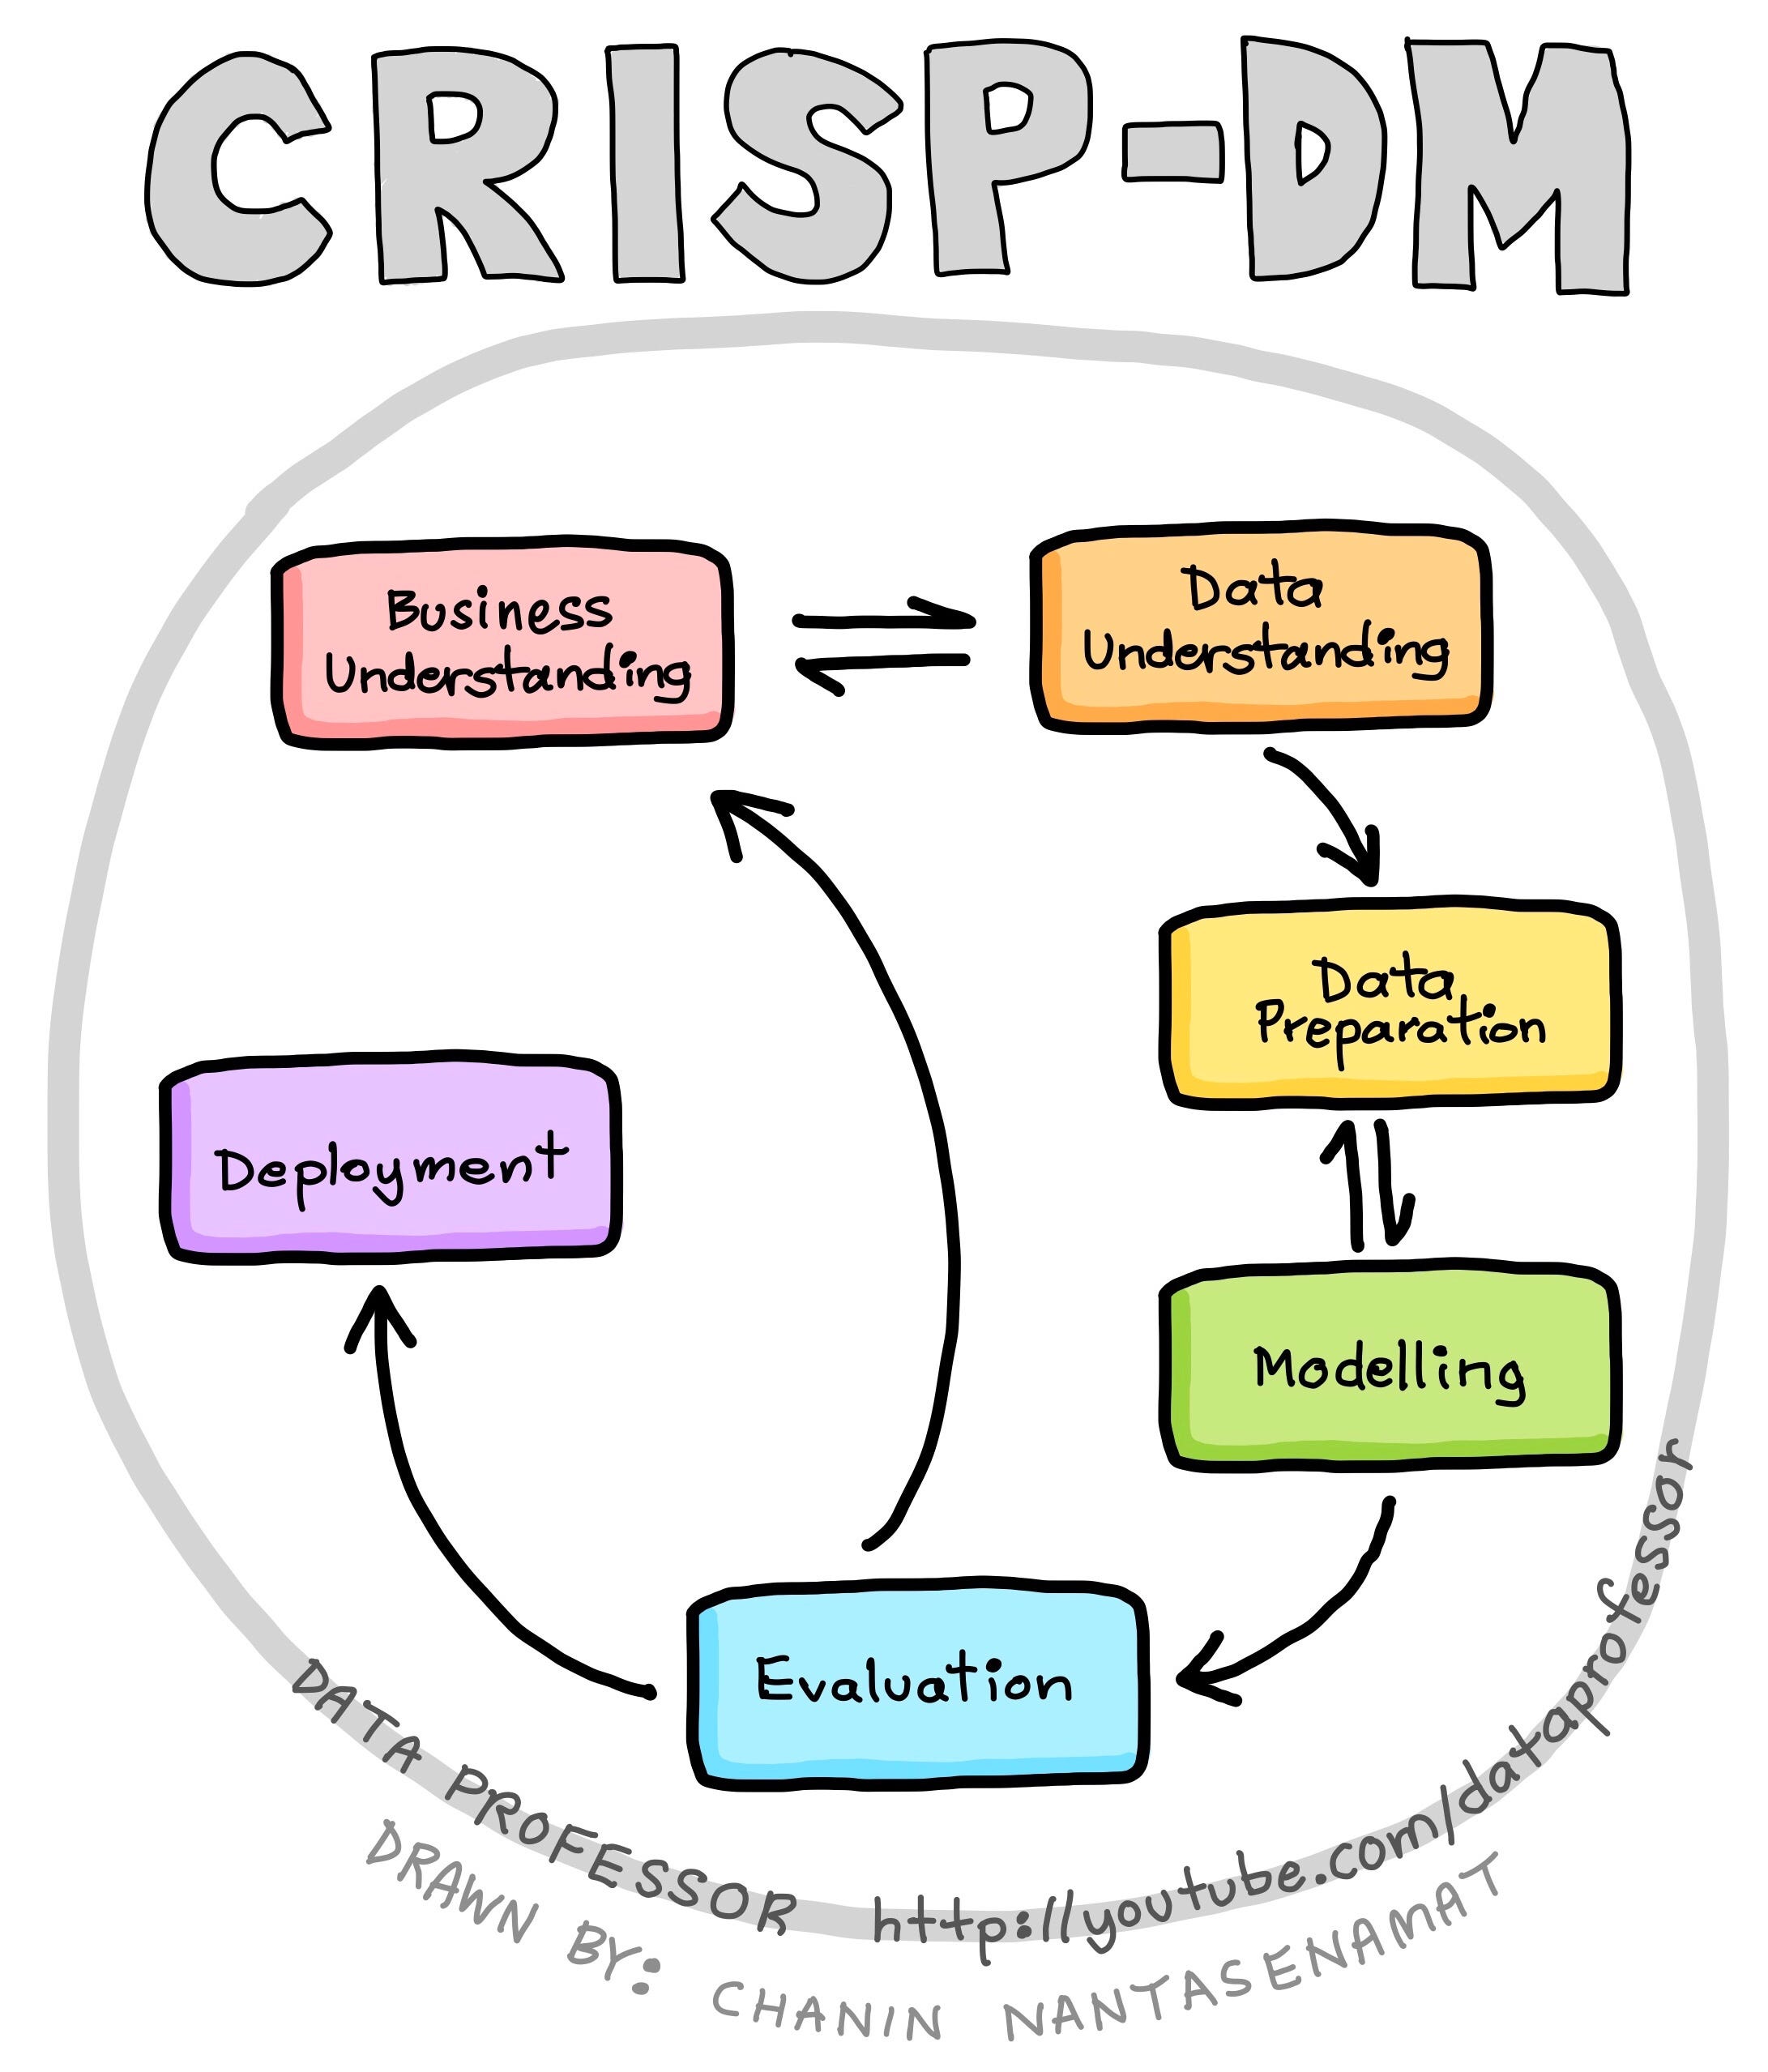
The CRISP-DM framework is comprised of 6 major steps:
- Business understanding — This entails the understanding of a project’s objectives and requirements from the business viewpoint. Such business perspectives are used to figure out what business problems to solve via the use of data mining.
- Data understanding— This phase allows us to become familiarize with the data and this involves performing exploratory data analysis. Such initial data exploration may allow us to figure out which subsets of data to use for further modeling as well as aid in the generation of hypothesis to explore.
- Data preparation — This can be considered to be the most time-consuming phase of the data mining process as it involves rigorous data cleaning and pre-processing as well as the handling of missing data.
- Modelling — The pre-processed data are used for model building in which learning algorithms are used to perform multivariate analysis.
- Evaluation — In performing the 4 aforementioned steps, it is important to evaluate the accrued results and review the process performed thusfar to determine whether the originally set business objectives are met or not. If deemed appropriate, some steps may need to be performed again. Rinse and repeat. Once it is deemed that the results and process are satisfactory then we are ready to move to deployment. Additionally, in this evaluation phase, some findings may ignite new project ideas for which to explore.
- Deployment — Once the model is of satisfactory quality, the model is then deployed, which may range from being a simple report, an API that can be accessed via programmatic calls, a web application, etc.
OSEMN
In a 2010 post “A Taxonomy of Data Science” on dataists blog, Hilary Mason and Chris Wiggins introduced the OSEMN framework that essentially constitutes a taxonomy of the general workflow that data scientists typically perform as shown in the diagram below. Shortly after in 2012, Davenport and Patil published their landmark article “Data Scientist: The Sexiest Job of the 21st Century”in the Harvard Business Review that has attracted even more attention to the burgeoning field of data science.
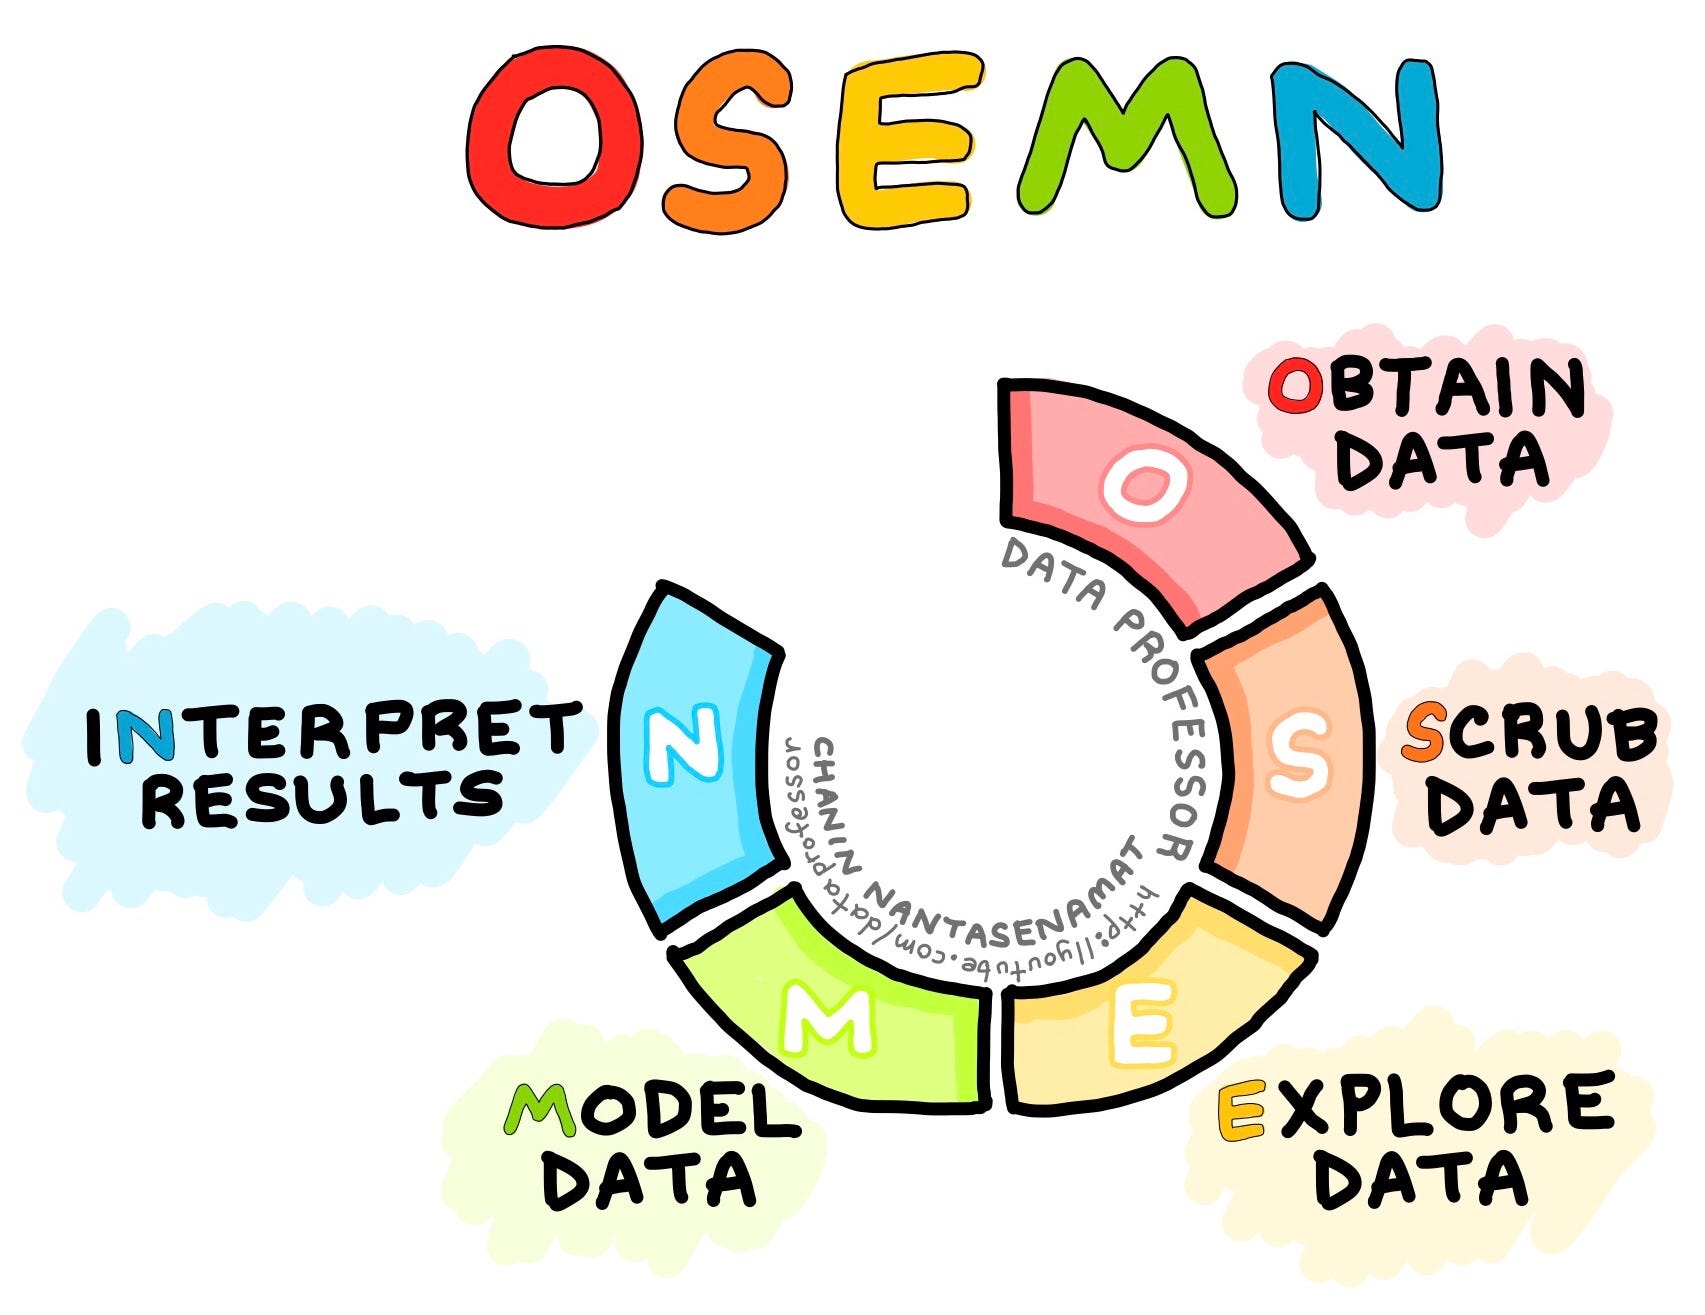
The OSEMN framework is comprised of 5 major steps and can be summarized as follows:
- Obtain Data — Data forms the requisite of the data science process and data can come from pre-existing ones or from newly acquired data (from surveys), from newly queried data (from databases or APIs), downloaded from the internet (e.g. from repositories available on the cloud such as GitHub) or extracted
- Scrub Data — Scrubbing the data is essentially data cleaning and this phase is considered to be the most time-consuming as it involves handling missing data as well as pre-processing it to be as error-free and uniform as possible.
- Explore Data — This is essentially exploratory data analysis and this phase allows us to gain an understanding of the data such that we can figure out the course of actions and areas that we can to explore in the modeling phase. This entails the use of descriptive statistics and data visualizations.
- Model Data — Here, we make use of machine learning algorithms in efforts to make sense of data and gain useful insights that are essential for data-driven decision-making.
- Interpret Results— This is perhaps one of the most important phase and yet the least technical as it pertains to actually making sense of the data by figuring out how to simplify and summarize results from all the models built. This entails drawing meaningful conclusion and rationalizing actionable insights that would essentially allow us to figure out what the next course of actions are. For example, what are the most important features that influences the class labels (Y variables).
Conclusion
In summary, we have gone covered the data science process by showing you the highly simplified data science life cycle along with the widely popular CRISP-DM and OSEMN frameworks. These frameworks provides a high-level guidance on handling a data science project from end to end where all encompasses the same core concepts of data compilation, pre-processing, exploration, modeling, evaluation, interpretation and deployment. It should be noted that the flow amongst these processes is not linear and that in practice the flow can be non-linear and can re-iterate until satisfactory condition is met.


