Setting the scene
You are a Data Scientist working for a commercial company. You spent weeks, or maybe even months, developing this deep learning-based model that accurately predicts an outcome of great interest to your business. You proudly presented the results to your stakeholders. Quite annoyingly, though, they did not pay much attention to that cutting-edge approach you used to build the model. Instead of focusing on how powerful the model was, they started asking lots of questions on why some of its predictions looked the way they did. Your colleagues also felt that some of the critical predictors were missing. They could not fully understand how the predictions were so accurate with those features missing. As the model you built was of a black box type, it was challenging for you to give satisfactory answers to all the questions straightaway. So you had to ask for a follow-up meeting and for some time to get prepared.
Sounds familiar? I have certainly been there a few times before. It is natural for us as humans to be uncomfortable with and do not trust things we do not understand. This also applies to the Machine Learning model and how people who are not Data Science experts perceive them. However, having an interpretable Machine Learning model is neither always possible nor necessary. To help me explain that to my stakeholders and clients, I have collected a few key ideas on the topic of model interpretability from various sources, including my own experience. I am sharing this collection here in this article. Hopefully, some of my fellow Data Scientists will also find it useful when preparing for similar conversations with their colleagues.
Be crystal clear about the model’s purpose
Clearly communicating the purpose of a model is one of the crucial factors that drive its adoption by stakeholders. There are several classifications of model purposes (e.g., Calder et al. 2018; Edmonds et al. 2018; Grimm et al. 2020). I personally prefer the one proposed by Leo Breiman, author of the famous Random Forest algorithm. In 2001, Breiman published a paper entitled “Statistical Modeling: The Two Cultures”. This paper has received lots of interest and citations as it for the first time initiated a widespread discussion on model interpretability vs predictive performance
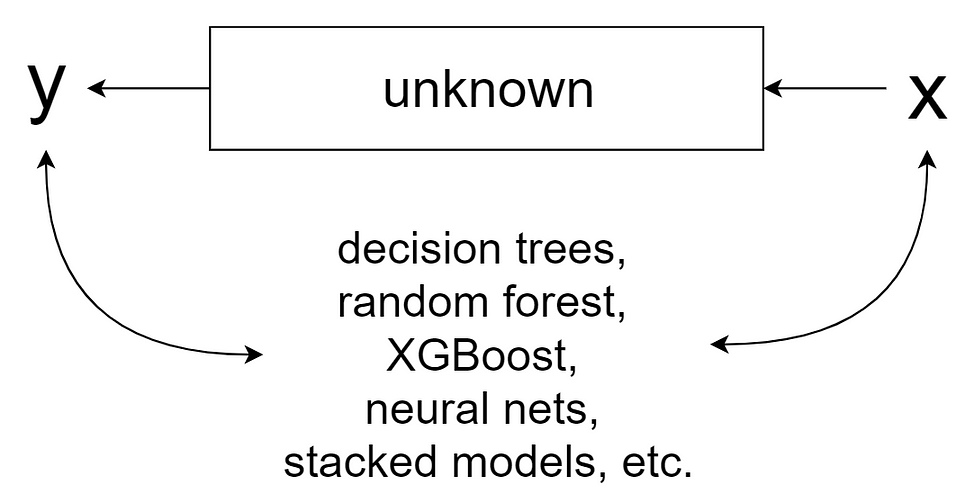
According to Breiman, data can be thought of as being generated by a black box, inside which Nature links a vector of input variables x to the outcomes y

The author then formulates two main goals of modelling:
- information: extracting insights on how Nature is linking x to y;
- prediction: providing accurate estimates of y based on the future values of x.
When communicating with the model end-users, it is essential to differentiate between these two goals. The reason is that the models used to achieve these goals typically differ in terms of their complexity, interpretability, and predictive power.
Articulate the trade-off between interpretability and predictive accuracy
Breiman (2001) distinguishes two approaches, or “cultures”, toward the goals of modelling.
The first approach, “data modelling”, assumes that the data-generating process can be described by a stochastic model, e.g. response = f(predictors, parameters, random noise).Such models tend to have a limited set of parameters, whose values are estimated from the observed data. Examples include linear regression, logistic regression, Cox regression, etc.:

Due to their relatively simple structure, models from this first category are typically used to shed light on how the system of interest operates. For instance, one can directly look at the coefficients of a linear regression model and quickly work out how changing the input values will affect the response variable. This also helps with formulating hypotheses that can subsequently be tested in controlled experiments. Although these models can certainly be used to make predictions, the quality of such predictions is usually not that high.
This is in contrast to models produced using the “algorithmic modelling” approach. This approach accepts the fact that the innards of Nature’s black box are complex and unknown. It then tries to find an arbitrarily complex function that provides accurate mapping of the input variables x to the response variables y. Models that belong to this category are typically more complex and fitted using such algorithms as Random Forest, XGBoost, neural nets, etc.:

Quality of the models produced with the data modelling approach is usually evaluated using statistical tests for goodness-of-fit and by examining the residuals. The result of this analysis is often binary: the model is either considered “good” or discarded as a “bad” one. In contrast, models built using the algorithmic modelling approach are assessed based on the accuracy of their predictions on an independent dataset. This is an important distinction, as it implies that we do not really care how complex an algorithmic model is or whether it passes statistical tests for goodness-of-fit. All that matters is that the model does not overfit and its predictive power is sufficiently high for the problem at hand.
Nowadays, businesses collect large volumes of increasingly more complex data. Solving real-world business problems that require high-quality predictions based on such data requires equally complex modelling. However, complex models are intrinsically more difficult to interpret. Although this trade-off is not always black-and-white, we can conceptually visualise it as follows:

It is our job as Data Scientists to articulate this trade-off to the end-users of our models. It can be challenging to do. However, as Cassie Kozyrkovsays in her brilliant article on this topic, “not everything in life is simple” and “wishing complicated things were simple does not make them so.”
How about LIME, SHAP, and other methods that “explain” black box models?
Interpretable Machine Learning (a.k.a. Explainable AI, XAI) is definitely a hot topic these days. Many academic researchers, developers of open-source frameworks, and vendors of commercial platforms are churning out novel methods to interpret the inner workings of complex predictive models. Examples of some of the well-known techniques include (see Molnar 2020 for a comprehensive overview):
-
- LIME (Local Interpretable Model-Agnostic Explanations);
-
- Shapely values and the associated SHAP method;
-
- partial dependence plot;
-
- feature importance;
-
- individual conditional expectation;
-
- accumulated local effects plot.
First of all, no Data Science project should be developed in a vacuum. This means that business stakeholders should be involved from Day 1. Before jumping into what we as Data Scientists love most — model building and playing with algorithms — we should strive to collect as much domain knowledge from our business colleagues as possible. On the one hand, embedding this knowledge in the form of input features would increase the chance of developing a highly performant model. On the other hand, this would eventually minimise the need to explain how the model works.
But sometimes we do develop models without much engagement from our stakeholders (e.g., as part of an R&D project). In such cases, I have found it useful to simply provide a detailed explanation of what input variables go into the model under discussion. Business folks will naturally have an intuition as to what variables are likely to drive the outcome of interest. And if they see that these variables are already part of the model, their trust toward it goes up.
Another powerful thing that often works well is exposing the model via a simple interactive web application to illustrate how predictions change depending on the input values. This can be done using any of the popular frameworks, such as Shiny, Dash, Streamlit. Let your stakeholders move those sliders and run the wildest what-if scenarios! This can dramatically improve their understanding of the model, better than any feature importance plot could do.
Remind your colleagues that correlation is not causation
Predictive models that capture actual mechanistic links between the input and the response variables are rather rare in business settings. This is especially true for the complex algorithmic models that include a large number of predictors. Most of these models make their predictions merely due to the <em>correlation</em> between predictors and the response variable. But, as the saying goes, “correlation is not causation”, or at least not always. This has two important implications when it comes to interpreting a predictive model.
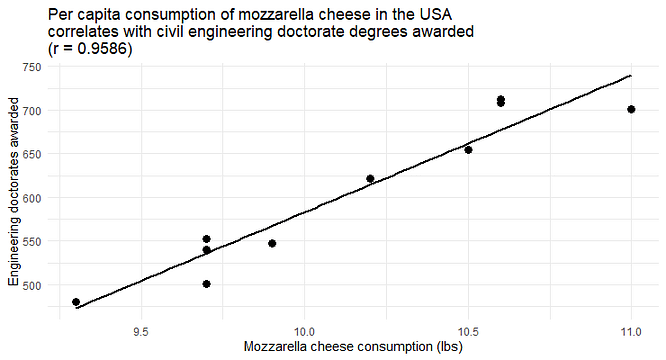
Firstly, it is possible to build a useful predictive model using input variables that have no actual association with the response variable. One can find lots of examples on the Internet of the so-called “ spurious correlations”. Here is one of them:

It is easy to build a simple linear regression model that would accurately predict the number of doctorate degrees awarded based on mozzarella cheese consumption. Can this model be successfully used in practice to estimate the number of doctorate degrees awarded in a given year? Thanks to the high correlation between the two variables, definitely yes. But something tells me that any attempt to interpret it would only trigger a good laugh in the room.
Secondly, it is often tempting to use insights gained from a predictive model to devise actions for controlling the response variable. However, if such a model is mainly based on non-mechanistic associations, doing so is likely to be meaningless, and sometimes can be even dangerous. For example, the relationship depicted above implies that increasing the per capita consumption of mozzarella cheese would result in more doctorate degrees awarded. Give it a moment to sink in… Would you recommend this to a decision maker whose goal is to strengthen the workforce with more civil engineers educated to a PhD level?
Explain the existence of multiple good model
By definition, any model is only an approximation of the process that generated the observed data. As this underlying process is unknown, the same data can often be described similarly well by very different models. In Statistics, this phenomenon is known as the “multiplicity of models” (Breiman 2001).
This phenomenon causes no problems as long as all we need from a model is high predictive accuracy. However, it becomes problematic if the goal is to gain insights about the data-generating process and then make practical decisions based on this information. The reason is simple: different models that fit the same data well can lead to remarkably different conclusions. And the worst part is that there is no way to tell which of these conclusions are correct (unless they are proved correct in a follow-up controlled experiment).
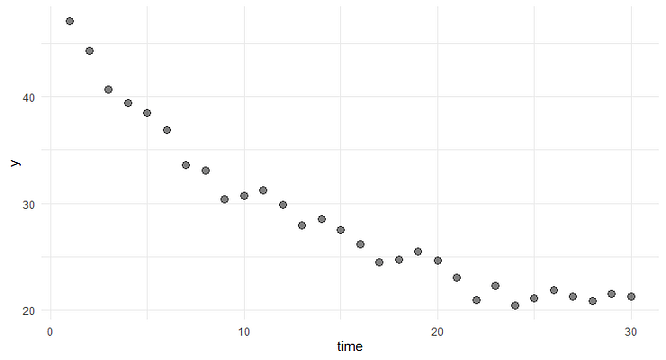
Here is a simple example. Suppose, we have a dataset that describes how a response variable y changes over time

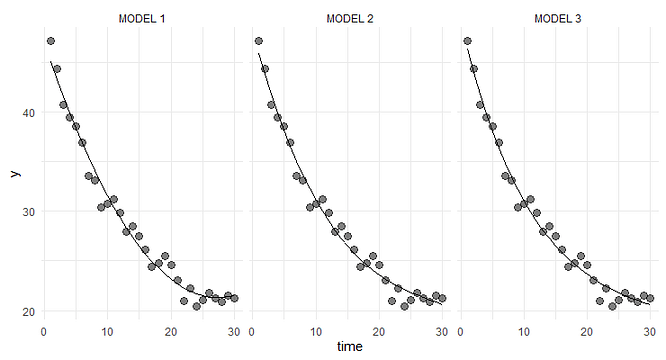
These data can be fitted similarly well (e.g., in terms of RMSE) by several structurally different models. For example:

The three models and their estimated parameters are as follows:

As we can see, Model 1 is a 2nd-degree polynomial, Model 2 — 3rd-degree polynomial, and Model 3 — exponential decay process. Obviously, these models imply different underlying mechanisms of how y changes over time.
In fact, this toy example is based on data simulated from the following model that defines an exponential decay process:

Thus, Model 3 corresponds to the actual process that generated the data, and it fits that process quite well (in terms of the parameter estimates). However, we would never know this in real life and might wrongly conclude that some other model provides a better description of the underlying process. In practice, using the wrong model for decision making could lead to unforeseeable negative consequences (Grimm et al. 2020).
Conclusion
Business users of Machine Learning models often ask to “explain” how models make their predictions. Unfortunately, providing such an explanation is not always possible. This is especially true for complex models whose main purpose is to make accurate predictions. Arguably, most of the models built by Data Scientists nowadays belong to this very category. Nevertheless, engaging stakeholders early on in the project and demonstrating that the model captures their domain knowledge and is well tested can help in building their trust toward that model.
This article was originally published on Medium, and republished with the permission of the author.


