Recently, I got asked about how to explain confidence intervals in simple terms to a layperson. I found that it is hard to do that.
Confidence Intervals are always a headache to explain even to someone who knows about them, let alone someone who doesn’t understand statistics.
I went to Wikipedia to find something and here is the definition:
In statistics, a confidence interval (CI) is a type of estimate computed from the statistics of the observed data. This proposes a range of plausible values for an unknown parameter. The interval has an associated confidence level that the true parameter is in the proposed range. This is more clearly stated as: the confidence level represents the probability that the unknown parameter lies in the stated interval. The level of confidence can be chosen by the investigator. In general terms, a confidence interval for an unknown parameter is based on sampling the distribution of a corresponding estimator. [1]And my first thought was that might be they have written it like this so that nobody could understand it. The problem here lies with a lot of terminology and language that statisticians enjoy to employ.
This post is about explaining confidence intervals in an easy to understand way without all that pretentiousness.
A Real-Life problem
Let’s start by creating a real-life scenario.
Imagine you want to find the mean height of all the people in a particular US state.
You could go to each person in that particular state and ask for their height, or you can do the smarter thing by taking a sample of 1000 people in the state.
Then you can use the mean of their heights (Estimated Mean) to estimate the average of heights in the state(True Mean)
This is all well and good, but you being the true data scientist, are not satisfied. The estimated mean is just a single number, and you want to have a range where the true mean could lie.
Why do we want a range? Because in real life, we are concerned about the confidence of our estimates.
Typically even if I ask you to guess the height of people in the particular US state, you are more inclined to say something like: “I believe it is between 6 foot to 6 Foot 2 Inch” rather than a point estimate like “Its 6 foot 2.2345 inches”.
We humans also like to attach a level of confidence when we give estimates. Have you ever said — “I am 90% confident”.
In this particular example, I can be more confident about the statement- “I believe it is between 5 foot to 7 Foot” than “I believe it is between 6 foot to 6 Foot 2 Inch” as the first range is a superset of the second one.
So how do we get this range and quantify a confidence value?
Strategy
To understand how we will calculate the confidence intervals, we need to understand the Central Limit Theorem.
Central Limit Theorem: The Central Limit Theorem(CLT) simply states that if you have a population with mean μ and standard deviation σ, and take random samples from the population, then the distribution of the sample means will be approximately normally distributed with mean as the population mean and estimated standard deviation s/√n where s is the standard deviation of the sample and n is the number of observations in the sample.
So knowing all this, you become curious. We already have a sample of 1000 people in the US state. Can we apply CLT?
We know that the mean of the sampling distribution is equal to the population mean(which we don’t know and want to estimate)and the sample deviation of the sampling distribution is given by σ/√n( i.e., the standard deviation of the sample divided by the number of observations in the sample)
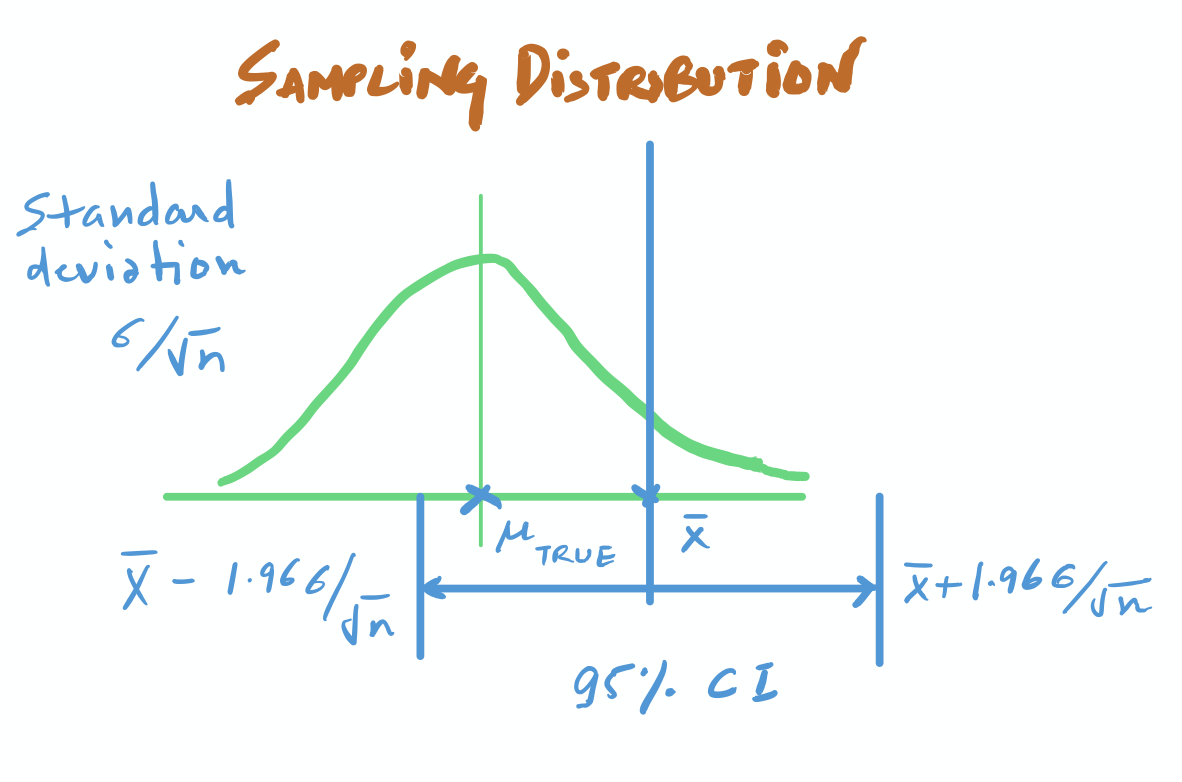
Now, you want to find intervals on the X-axis that contains the true population mean.
So what do we do? We cast a net from the value we know.
To get such ranges/intervals, we go 1.96 standard deviations away from Xbar, the sample mean in both directions. And this range is the 95% confidence interval.
Now, when I say that I estimate the true mean to be Xbar (The sample Mean) with a confidence interval of [Xbar-1.96SD, Xbar+1.96SD], I am saying that:
That this is an interval constructed using a certain procedure. Were this procedure to be repeated on numerous samples, the fraction of calculated confidence intervals (which would differ for each sample) that encompass the true population parameter would tend toward 95%
When you take 99% CI, you essentially increase the proportion and thus cast a wider net with three standard deviations.

- Here Xbar is the sample mean(mean of the 1000 heights sample you took).
- Z is the no of standard deviations away from the sample mean(1.96 for 95%, 2.576 for 99%) — level of confidence you want.
- s is the standard deviation in the sample.
- n is the size of the sample.
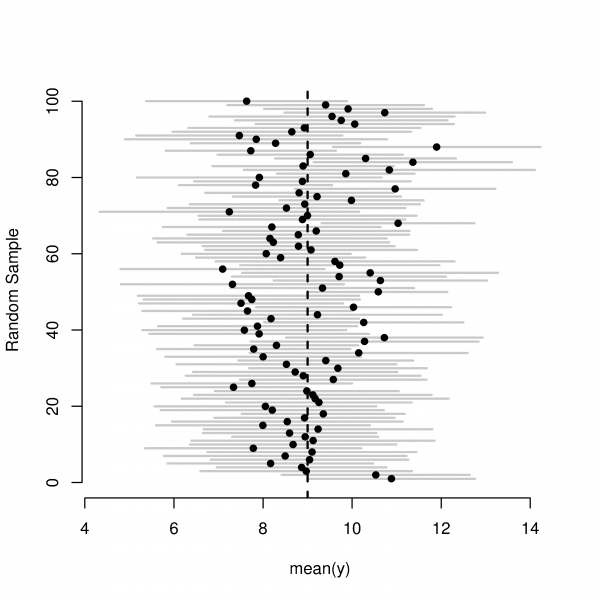
“Most of the nets we cast in different experiments do contain the true population mean”
Each line in the figure above is one such experiment where the dot signifies the sample mean, and the line signifies the range. The dotted line in this figure is the true population mean.
The Critical Z value
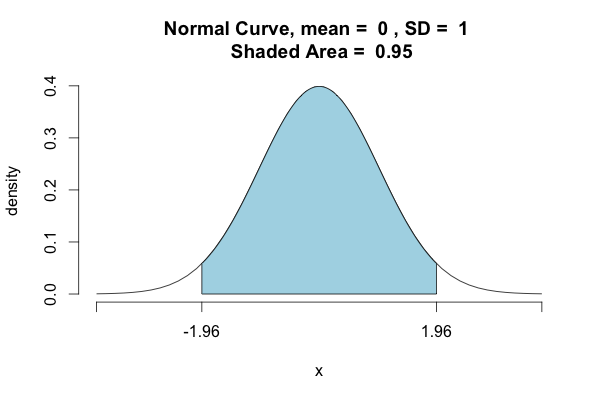
As we said, Z is the no of standard deviations away from the sample mean(1.96 for 95%, 2.576 for 99%) — level of confidence you want.
You can go for any arbitrary level of confidence. Say, for example, you want 90% confidence. You can get that by using the idea that the shaded area inside the normal curve needs to be 0.90.
import scipy.stats as st
p = 0.9 + (1-0.9)/2
Z = st.norm.ppf(p, loc=0, scale=1)
print(Z)
----------------------------------------------------------
1.6448536269514722