So far in this series I have explained the concept of a data library and the principles behind it. Now I will explain how it interacts with the various building and water metaphors for data storage.
There is no shortage of data metaphors to draw from for your data library
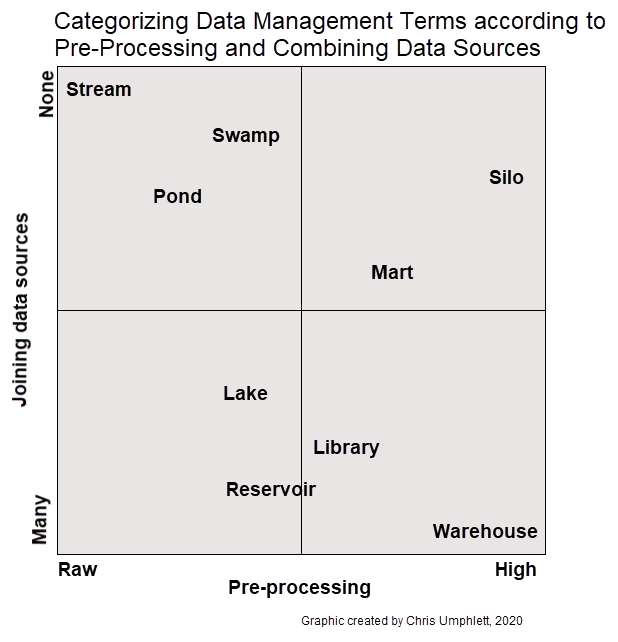
Metaphors explaining how data should be stored have been around for decades. No rock-solid consensus exists for what each of these terms mean. But they can be categorized according to the level of pre-processing that happens before storage and whether data sources are joined together. Overall, “water” terms tend to be grouped on the left side of this matrix and “building” terms on the right side, with variability within each at the top and bottom.
A data library utilizes multiple types of data storage strategies. It should start with collecting raw data and storing it with minimal processing and seldom joining with other data sources. More processed tables are created from the raw data, sometimes bringing together disparate data sources. I prefer the terms “data pond” and “data reservoir,” which both are explained well in this article from Exago BI.
From that article:
DATA PONDS A series of isolated repositories of raw data in its native format, also referred to as “data puddles,” used as a temporary intermediary location for raw, just-imported information.
DATA RESERVOIR A repository of data that has undergone information management and governance, which typically includes access controls, transformations enforcing semantic consistency, and cataloging methods.
As mentioned in the previous article about the location for a data library, creating six databases on the same server is a good approach. There are three types of databases, with a development and production version of each.
Data Ponds
The data pond database (or file storage) contains one or more schemas where each schema represents a data pond for a distinct source of data. The schema will contain one or more tables that strictly store data from that source. Suppose one wants to add Google Analytics data to a data library. A schema called GoogleAnalytics (or whatever naming convention is standard) might contain tables such as “Sessions,” “Visitors,” “Pages,” and “Goals.” Digital marketing analysts are given access to this schema.
My approach to building data ponds is to do some transformation but little filtering. I previously have described the long structure I prefer for tables. This is the structure I utilize within the data pond. These tables only can store structured data, not semi- or un-structured data. If the source data is semi-structured, then transform it into structured data before adding to the data pond. For example, APIs typically return data in a JSON format, which easily is converted into a table in R, with the `httr` and `jsonlite` packages.
Analytics Reservoirs
Reservoirs facilitate the “readiness” of the data library. The Analytics reservoir contains things such as reference tables, feature-engineered data sets used for machine learning models, and the predictions and accuracy metrics produced by a modeling process.
A schema for reference tables can hold various lookup tables used throughout an organization for many reporting and analysis processes. At TechSmith this includes a table with all known “freemail” and public email domains and a table with all product release dates. Reference tables in an analytics reservoir reduce redundancy and inconsistency when compared to a situation where different individuals and teams have their own version of truth.
Data scientists and statisticians developing models want to iterate quickly. Using an analytics reservoir with ready modeling data sets reduces the processing time involved in data preparation. These modeling data sets refresh regularly and automatically after the source data ponds update.
Storing model outputs supports good practices for evaluation of a model (outside the scope of this article) and data health. If model performance drifts, or if output is irregular for a particular run, this may indicate an underlying data health issue in a data pond. Keeping this output in the database facilitates the creation of data health checks that help to ensure production models perform well.
Reporting Reservoirs
Reporting reservoirs contain data that is ready to be visualized or reported in a table. Creating these data sets automatically lowers the friction for someone else to create a new report and eliminates the need to have every analyst go through training on a particular BI software to produce reports. With Power BI, for instance, it is quite simple to load a table and create visuals and a dashboard. A new Power BI user could figure this out quickly. But if data needs to be transformed through Power Query, or measures created with DAX, then the developer will need to have expertise in those areas.
The reporting reservoir is the best place for storing data health measures, which are useful only if presented pro-actively to an analytics team. Data health checks should be performed automatically if possible and ideally a report with alerts is utilized to notify the team of any potential problems.
Using Development and Production Versions
Each area of the data library should have two parallel versions, one for development and one for production. You may choose to do all new work and updates in the development area and then follow a “promotion” workflow, or only use the development environment on an as-needed basis for actions that risk deleting data or interrupting an important process.
The development environment is the right home for half-baked ideas and experiments. The production environment should host only files or tables that have followed all of the data library principles and comply with your team’s standards. Production data should be documented, but development data does not need to be.
Ongoing reports, frequently used models, and other regular processes should point to production. It is tempting to take shortcuts. But it is better to complete the steps to add data to production first and then reap the benefits of efficiency, reliability, and accuracy that will come as you utilize the data.