Debugging is a funny-sounding word. The word originates from an actual bug getting in a computer and impeding the computer’s function back in the first computers’ times. Since then it has taken a new meaning. Now, it means finding the source of a problem in your code and resolving it.
When you’re first starting out with coding, debugging your code or resolving errors can be one of the hardest things to do. After all, the courses that teach how to code do not provide you with the tools you need to find the source of a problem and fix it. So aspiring data scientists feel lost and confused when they encounter an issue in their code.
It’s actually not at all that complicated. You only need to make sure to follow some simple procedures to determine the source of your problem. Let’s see what they are.
Read the error
It sounds obvious, I know, but it’s very common for someone who recently started coding to think of the error message as gibberish. This leads to them not utilising the whole potential of this error message and ending up aimlessly poking around in the code while trying to figure out the problem. That’s why it’s the first thing you should do, read, actually read the error message. Very likely, it will tell you exactly what went wrong.
Let’s look at some examples:
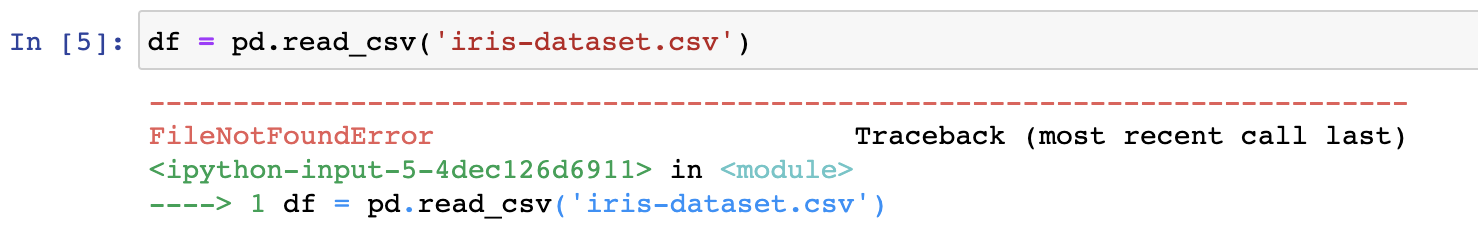
In this case, the code tells us, it couldn’t find the file because it does not exist. So, I know your first reaction would be to say, “no the file is there, here I’m looking at it”. Instead of getting flustered though, it’s important to understand what the message means. And no worries, in time, you will get better at recognising the meaning behind certain errors as you will see them a lot.
Your code is not calling you a liar, it’s merely saying that it could not find the file named iris-dataset.csv in the place you said it would find it. This could mean that:
- you have a typo in the name of the file or
- your file is not in the same folder as your notebook.
So you might need to:
- make sure the name is written correctly (in this case it was iris_dataset.csv – with an underscore and not a dash) or
- add the name of the folder where this piece of data is.
Another example:
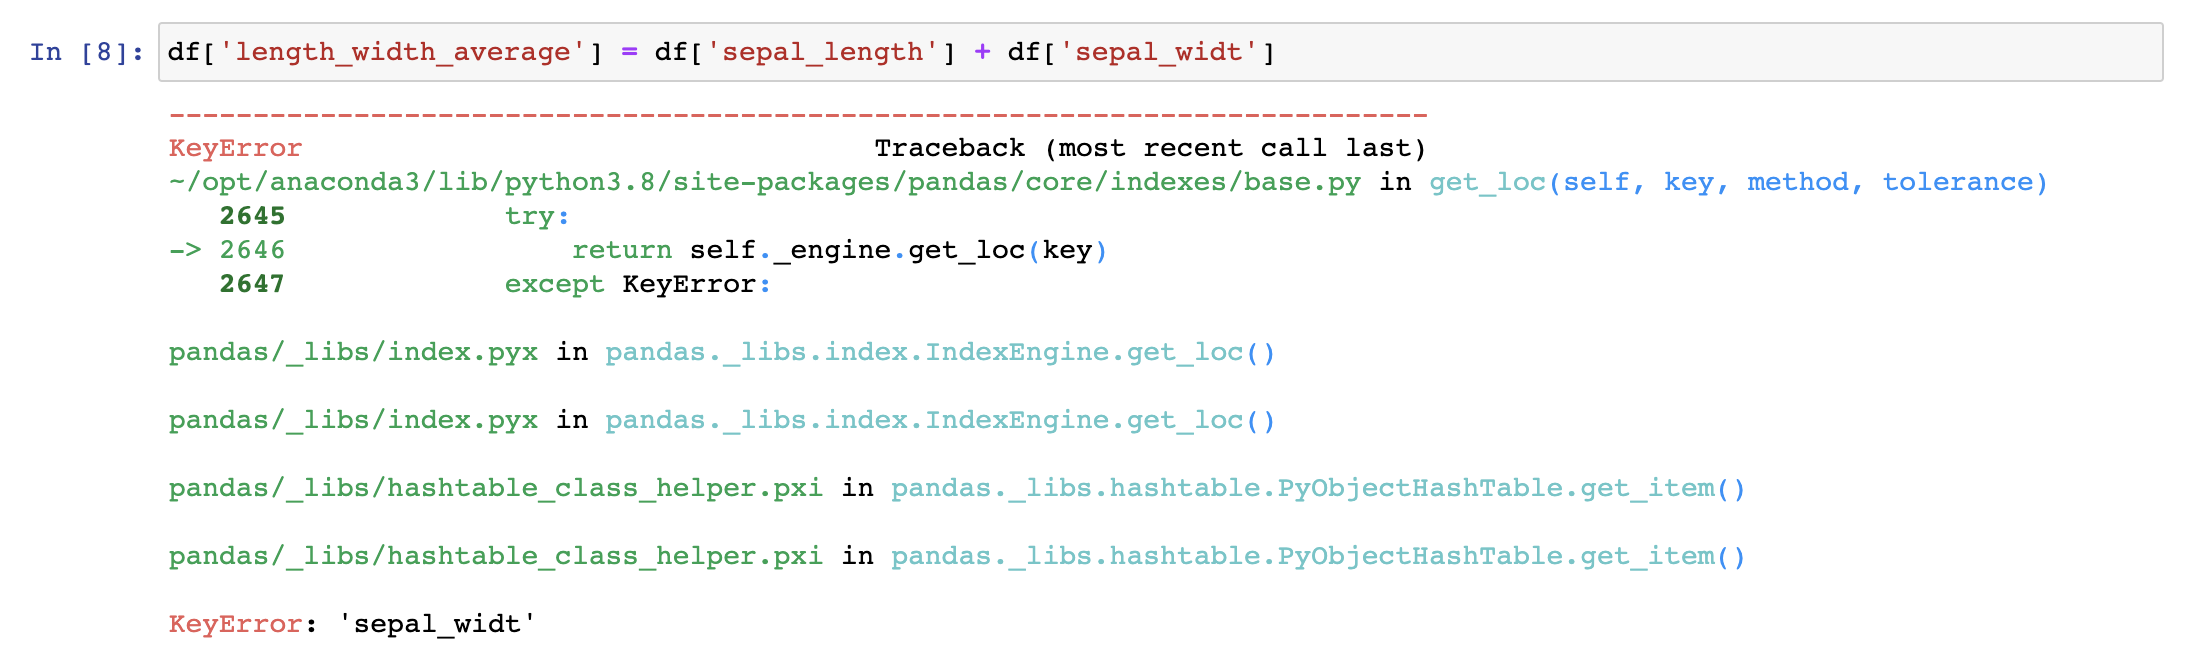
Looks scary but all it is telling you is that there is no such column named “sepal_widt” in your data. This could mean that:
- you forgot to include all the columns you wanted in your data frame or
- you have a typo.
I’ll tell you how to understand which one is the case later in this article. I chose the two examples above because they are fairly common in data science work. But there is yet another trick to reading the error message: following the trace of the error. For example, in the example below, we get a TypeError.
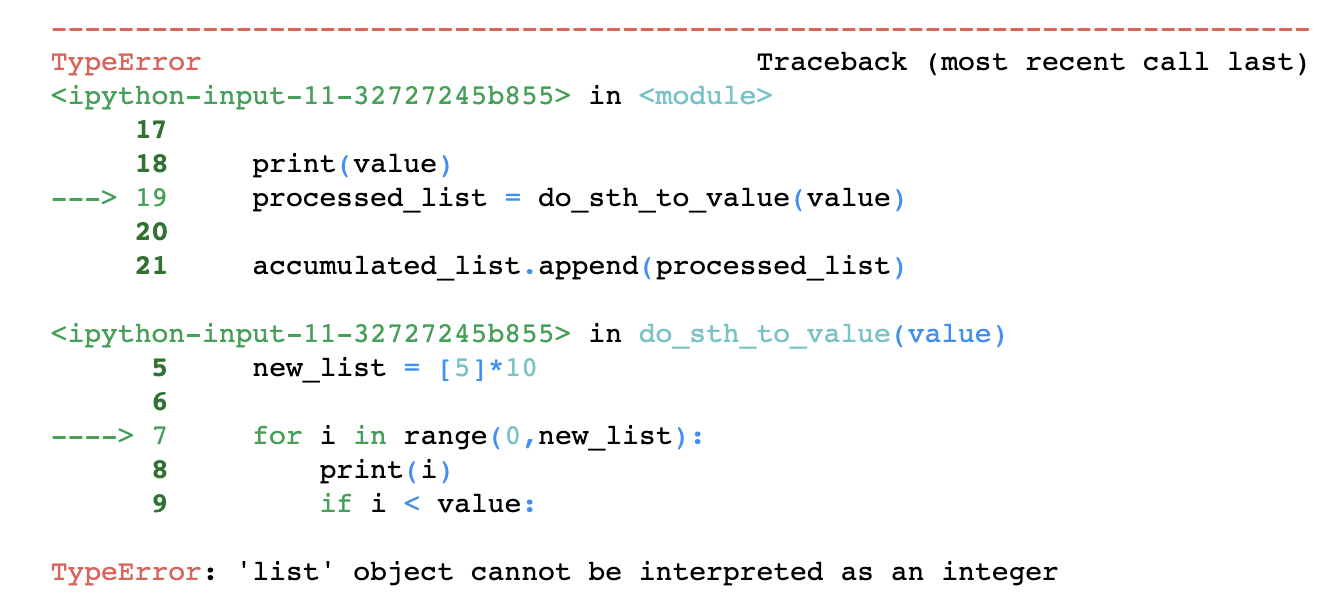
So, TypeError sounds very abstract but we can trace the error thanks to the Traceback feature to understand the cause of this error. The upper arrow points to the line in our code that caused this error. But it doesn’t end there, because the error it points to happens inside another function. A function that this piece of code calls. So it shows you when things went wrong inside that function with the lower arrow. This way, you know where to go to fix your issue.
A small note here; this error might be caused not by the exact line of code the Traceback arrow points to but by a value you are setting in a different part of this code. We’ll see how to follow this back too in this article.
Google the error no matter how unusual it seems
When you get an error for the first time, it might feel like you’re the first person on the face of the earth to get that error. But 99.999% of the time, unless you are working with a framework or a library that very few people use, Google will have an answer for you.
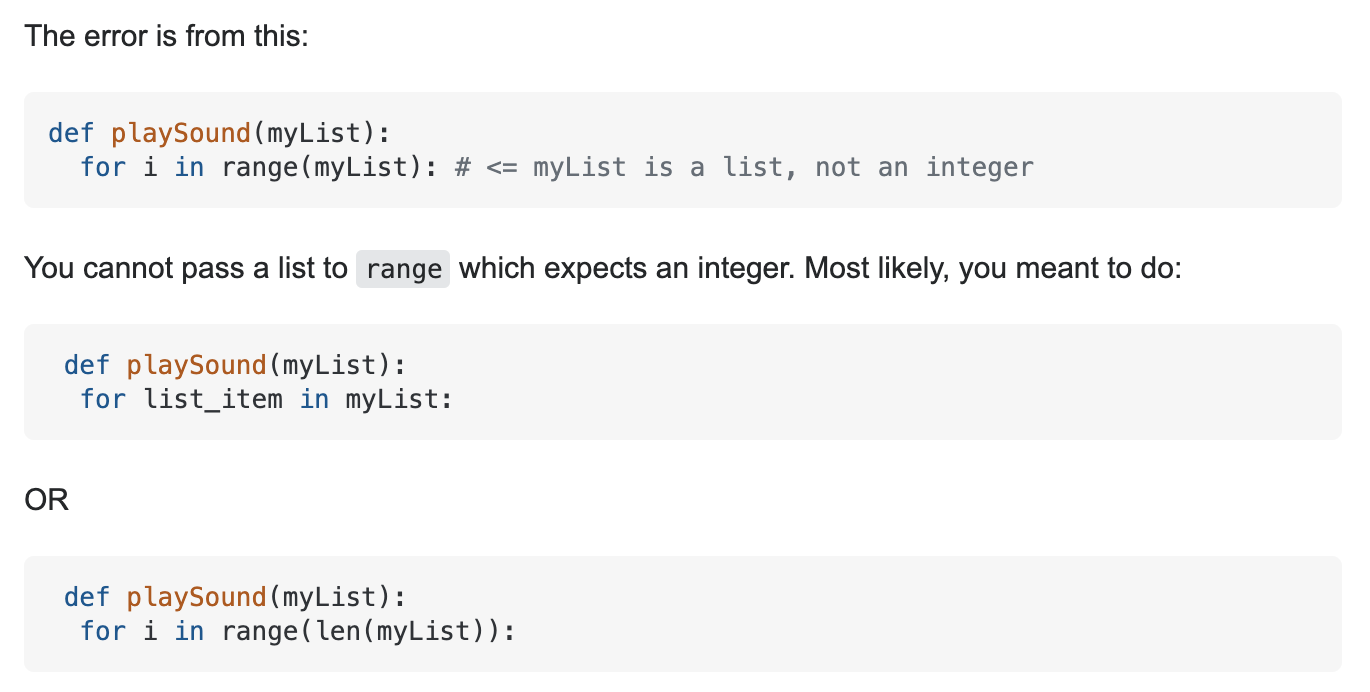
All you have to do is to copy and paste the exact error you are seeing. In the previous image, for example, do not copy and paste the whole message but only the part where it says “TypeError: ‘list’ object cannot be interpreted as an integer.”
Here is what I found Googling this error. And yes, that’s exactly the problem with this code.
Googling errors is good for understanding error messages and sometimes also to get a solution. But apart from resolving errors, you will learn a ton just by reading other people’s take on these errors. The more you code, get errors and fix them, the more you will understand what they mean by just reading the error messages and eventually the less you would need to consult Google.
On Jupyter notebooks, work backwards
Working on a notebook environment means that it is easy to run parts of the code and see results. We don’t only divide our codes into different cells of the notebooks because it’s fun. It is a way to observe the flow of the data and check that everything runs smoothly and as expected.
So when you run into an error (or a piece of code doesn’t output what you expected it to), your next step should be tracing back the problem.
What I do is printing the variables/dataframes I used in a certain cell and compare them to what I expected to see. This includes checking the values with df.head() or checking the types of columns with df.dtypes.
Let’s see an example. Let’s say I have a data frame with sepal_lengths and sepal_widths of flowers. And I created a new column taking the average of these two value. But when I plot them, I see that the value of the average column is unexpectedly not between the sepal_length and sepal_width value. Obviously, something is wrong.
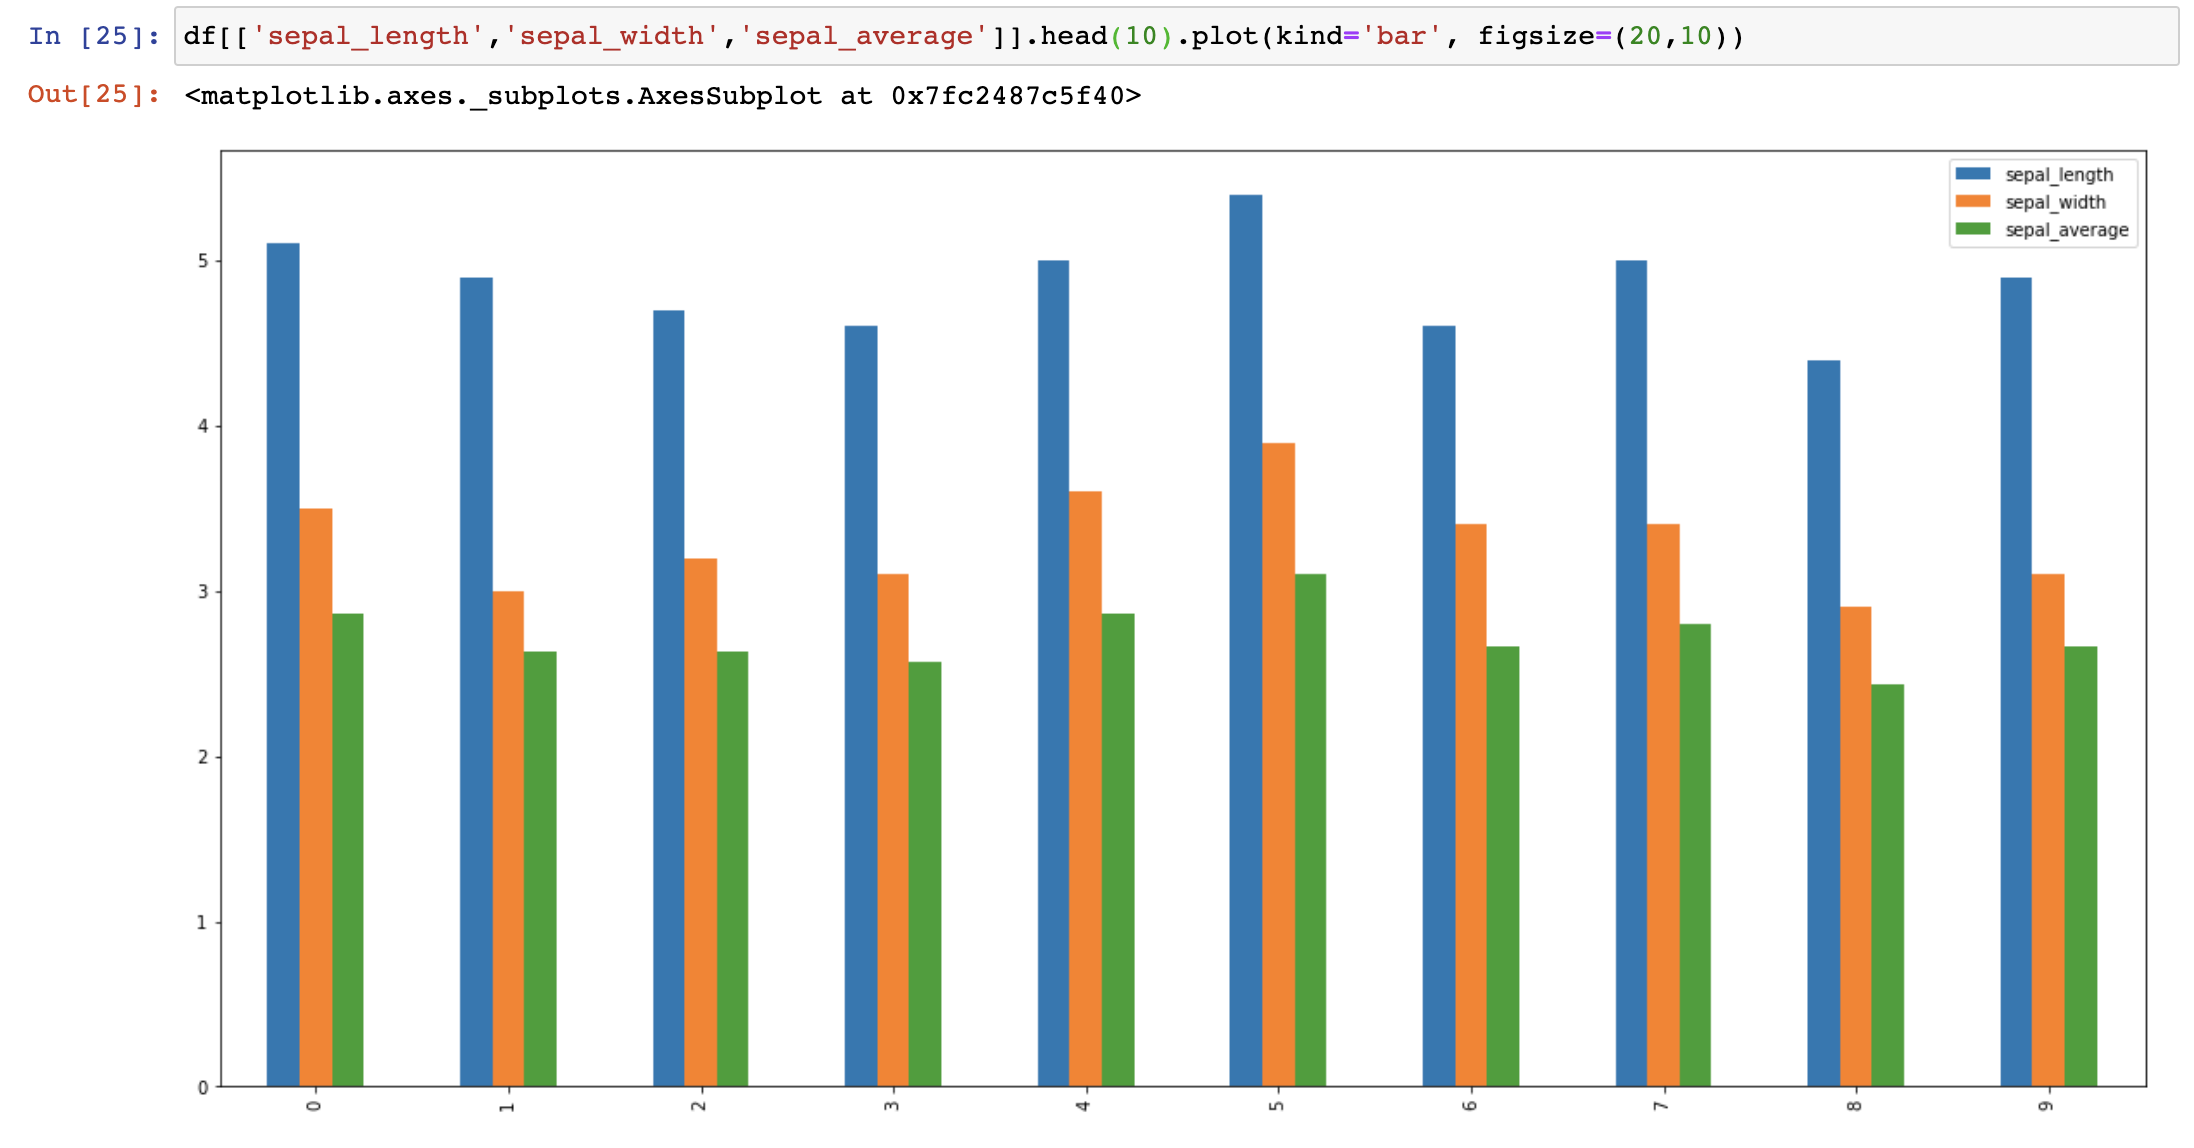
What I do then is to print out the data frame I use in this plot to see what the data looks like. Looking at the data I see that the sepal_average value does not reflect the average of sepal length and sepal width. Most likely something is wrong with the calculation of this new column.
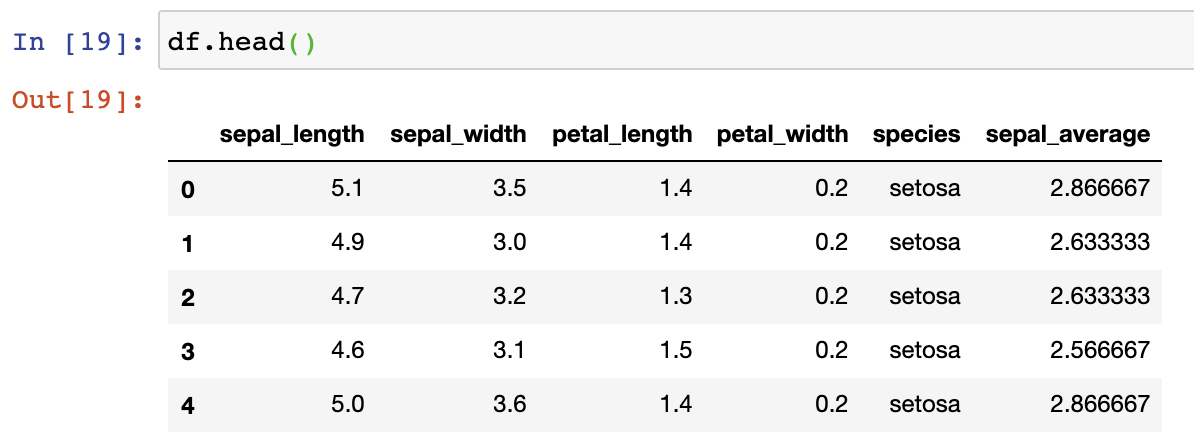
And yes, checking the calculation of the new average column, I see that I divided the sum by 3 and not 2.

Of course, problems are not always this obvious. The same problem might have been caused by me accidentally changing the value of sepal_average column after I set its value. But by working backwards from the issue and inspecting where I altered the values of the problematic column will always help me find the source of the issue.
Write prints for more complex code
Sometimes your code might have functions, loops and other complex structures making it hard for you to manually trace errors back. In that case, one workaround is to use the print command to your advantage. Let’s look at an example:
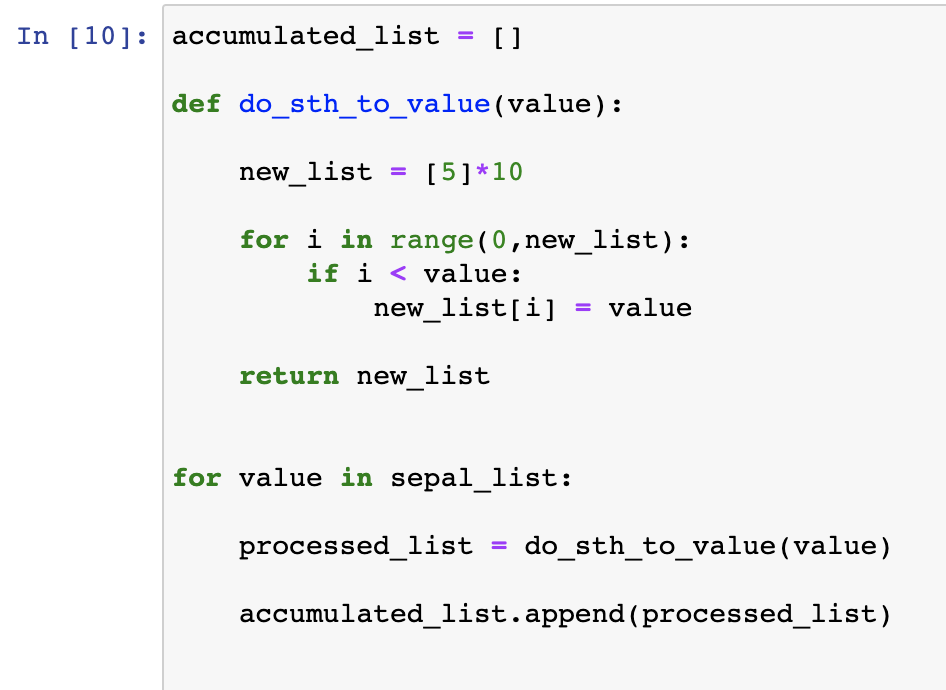
Let’s say when you run this code, the accumulated_list value does not look like what you expected it to look like, or something in this code is giving you an error and you don’t understand it. In that case, you can put print commands in certain places where some sort of value transformation is happening to see what is going wrong.
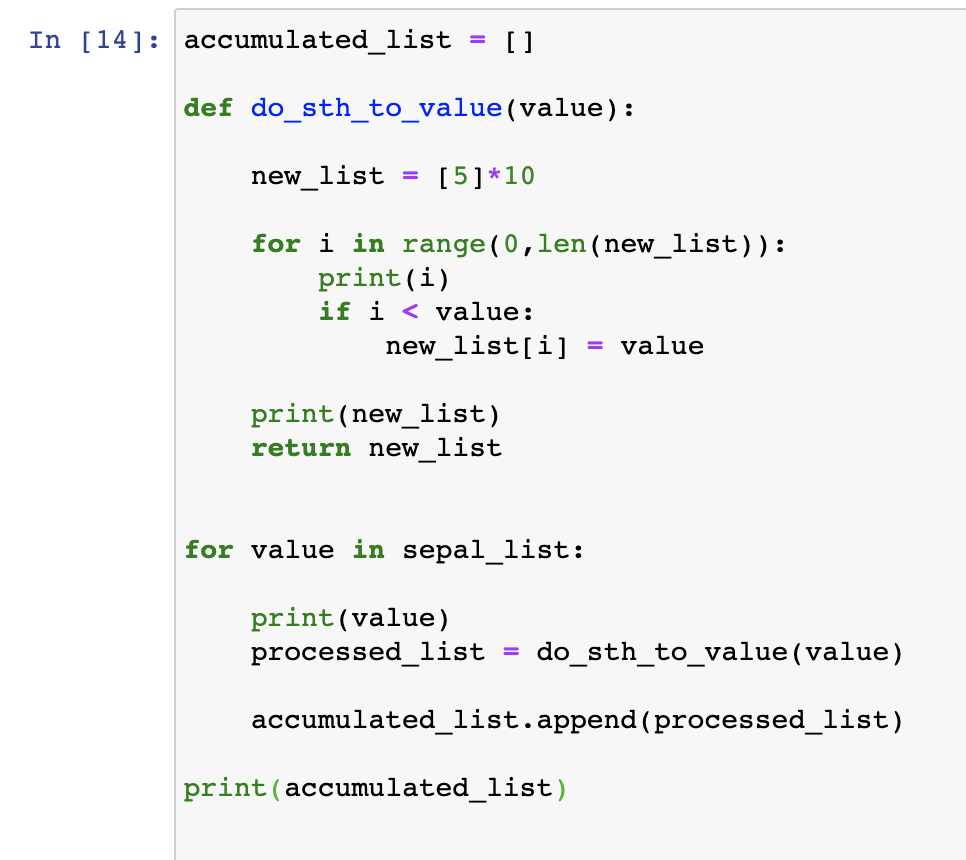
And with the new additions, you will print the value your code is working with. You will be able to observe what happens to that value over time and what the intermediate list (new_list) looks like. It will help you pin down the exact line things start looking unexpected or what the values of your variables are right before an error is triggered. Thus, giving you more insights on how to resolve the issue.
And that’s it, just by using these simple 4 ways of inspecting your errors, you can become much more efficient in debugging your code. And as I said in another article, no worries if it takes you some time to resolve issues or it takes a while before you get used to dealing with errors. By working hands-on, you’re training your brain to see patterns and resolve issues more and more quickly every time. Personally, I found that debugging and hunting for answers online is responsible for a lot of my current knowledge. So don’t let errors and issues discourage you and keep at it!
Originally published in soyouwanttobeadatascientist