An example in R language of how to check feature relevance in a binary classification problem
One of the main tasks that a data scientist must face when he builds a machine learning model is the selection of the most predictive variables. Selecting predictors with low predictive power can lead, in fact, to overfitting or low model performance. In this article, I’ll show you some techniques to better select the predictors of a dataset in a binary classification model.
When a data scientist starts working at some model, he often doesn’t have a real idea of which the predictors should be. Maybe the previous phase of business understanding discarded some useless variables but we often have to face a giant table of hundreds of variables.
Training a model on such a huge table is not a good idea. You really run the risk of collinearity (i.e. correlations between variables). So we have to choose the best set of variables to use in order to make our model learn properly from the business information we are giving it.
Our goal is to increase the predictive power of our model against our binary target, so we must find those variables that are strongly correlated with it. Remember: information is hidden inside the dataset and we must provide all the necessary conditions to make our model extract it. So we have to prepare data before the training phase in order to make the model work properly.
Numerical and categorical predictors have a different kind of approach and I’ll show you both.
Numerical variables
Since our problem is a binary classification task, we can consider our outcome as a number which can be either equal to 0 or 1. In order to check if a variable is relevant or not, we can calculate the absolute value of the Pearson linear correlation coefficient between the target and the predictors.
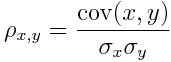
That is the covariance divided by the product of the standard deviations.
We are not interested in the sign of correlation. We just need to know its intensity. That’s why we use the absolute value.
I have often seen this kind of approach in many AI projects and tools. Honestly, I have to say that it’s not completely correct to calculate the correlation coefficient in this way. For a perfect predictor, we expect a Pearson coefficient absolute value equal to 1, but we could not achieve this value if we treat binary outcome as a binary number. It’s not important, however. We are using Pearson correlation coefficient to sort our features from the most relevant to the least one, so as long as the coefficient calculation is the same, we can compare the features between them.
Pearson correlation coefficient is not flawless, however. It only measures linear correlation and our variables couldn’t be linearly correlated. But in first approximation, we can easily calculate and use it for our purpose.
Categorical variables
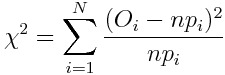
For the categorical variables, there’s no Pearson correlation coefficient, but we can use another great discovery of Pearson, which is the chi-square test.
Let’s say we have a histogram of N different categories with O observation that sum up to n and let’s say want to compare it with a theoretical histogram made by probabilities p. We can build a chi-square variable in this way:
This variable is asymptotically distributed as a chi-square distribution with N-1 degrees of freedom.
This variable is asymptotically distributed as a chi-square distribution with N-1 degrees of freedom.
If our variable is not correlated to the target, we expect that, for each one of its values, we get 50% zeroes and 50% ones on our dataset. This is a theoretical histogram we could expect to have if there’s no correlation, so a one-tailed chi-square test performed to check whether the real histogram is similar to this one, should give us a p-value equal to 1 (i.e. a low chi-square value) if our variable is not correlated to the target. On the contrary, a perfect predictor will push p-value towards lower values (i.e. higher chi-square values).
Example in R
To better explain the procedure I’ll show you an example in R code. I’ll work with the famous iris dataset.
Remember that R has a powerful function cor that calculates the correlation matrix and the function chisq.test that performs the chi-square test.
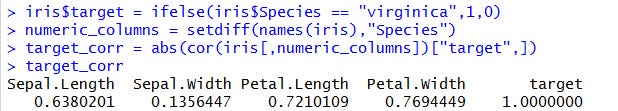
First, we create a column named target that is equal to 1 when the species is virginica and 0 otherwise. Then we’ll check the correlations with the other variables.
Let’s start with the numerical features. With this simple code, it’s very easy to find the most correlated ones.
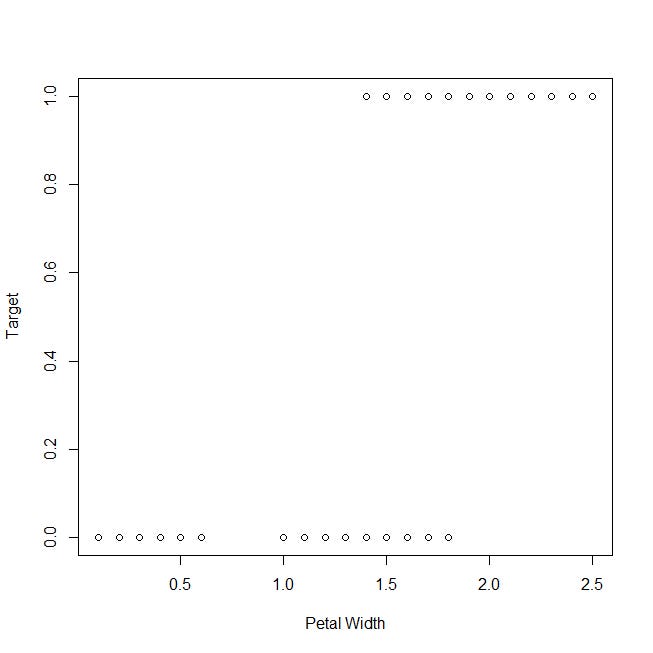
Let’s take a look at the plot of the target variable against the petal width:
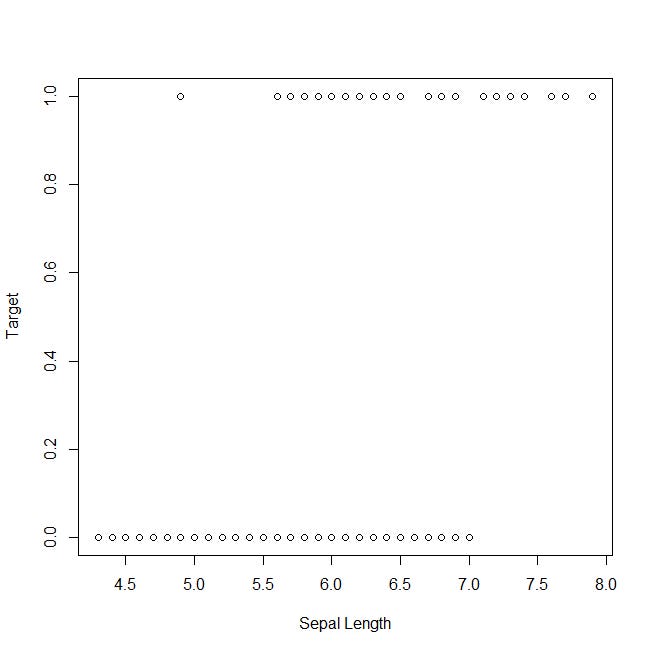
Now, let’s take a look at the plot of the target against the sepal length, which has been classified as the least representative variable:
For the categorical case, we’ll calculate the correlation between the target and the species variables. Of course, we expect a strong correlation, because we have built the target as a direct function of the species.
I’ll show you the single-line code and the results:
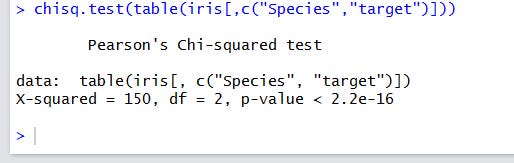
A very low p-value means a very strong difference from the uncorrelated case. As usual in the hypothesis tests, you don’t actually accept the null hypothesis, but refuse to neglect it.
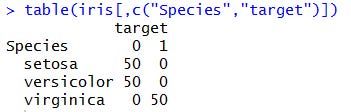
We can get further confirmation by taking a look at the contingency table:
Conclusions
In this article, I’ve shown you two simple techniques in R to measure the importance of numerical and categorical variables against a binary target. There are many more methods that can be used both with a multi-class categorical target and for a numerical target (i.e. regression).
However, this simple procedure can be used to check at first the most important variables and start a deeper analysis to find the best set of predictors for our model.