How To Measure The Goodness Of A Regression Model

Gianluca Malato Gianluca Malato
March 16, 2020 AI & Machine Learning

A simple study on how to check the statistical goodness of a regression model.

How To Measure The Goodness Of A Regression Model

Photo by Antoine Dautry on Unsplash

Regression models are very useful and widely used in machine learning. However, they might show some problems when comes to measure the goodness of a trained model. While classification models have some standard tools that can be used to assess their performance (i.e. area under the ROC curve, confusion matrix, F-1 score etc.), regression models’ performance can be measured in many different ways. In this article, I’ll show you some techniques I’ve used in my experience as a Data Scientist.


Example in R

In this example, I’ll show you how to measure the goodness of a trained model using the famous iris dataset. I’ll use a linear regression model to predict the value of the Sepal Length as a function of the other variables.

First, we’ll load the iris dataset and split it in training and holdout.

data(iris)
set.seed(1)training_idx = sample(1:nrow(iris),nrow(iris)*0.8,replace=FALSE)
holdout_idx = setdiff(1:nrow(iris),training_idx)training = iris[training_idx,]
holdout = iris[holdout_idx,]


Then we can perform a simple linear regression in order to describe the variable Sepal.Length as a linear function of the others. This is the model we want to check the goodness of.

m = lm(Sepal.Length ~ .,training)

All we need to do now is compare the residuals in the training set with the residuals in the holdout. Remember that the residuals are the differences between the real value and the predicted value.

training_res = training$Sepal.Length – predict(m,training)
holdout_res = holdout$Sepal.Length – predict(m,holdout)


If our training procedure has produced overfitting, the residuals in the training set will be very small compared with the residuals in the holdout. That’s a negative signal that should invite us to simplify the model or remove some variables.

Let’s now perform some statistical checks.

t-test

The first thing we have to check is whether the residuals are biased or not. We know from elementary statistics that the mean value of the residuals is zero, so we can start checking with a Student’s t-test if it’s true or not for our holdout sample.

t.test(holdout_res,mu=0)

How To Measure The Goodness Of A Regression Model

As we can see, the p-value is greater than 5%, so we cannot reject the null hypothesis and can say that the mean value of the holdout residuals is statistically similar to 0.

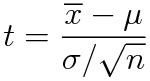
Then, we can test if the holdout residuals have the same average as the training ones. This is called Welch’s t-test.

t.test(training_res,holdout_res)

How To Measure The Goodness Of A Regression Model

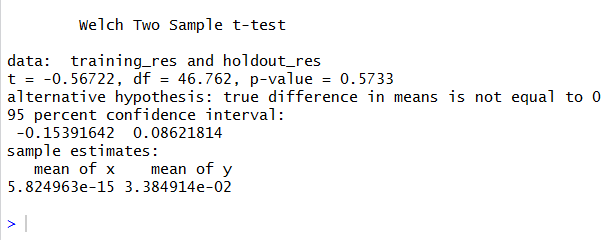
Again, a p-value higher than 5% can make us tell that there aren’t enough reasons to assume that the mean values are different.

F-test

After we have checked the mean value, there comes the variance. We obviously want that the holdout residuals show a behavior not so much different from the training residuals, so we can compare the variances of the two sets and check whether the holdout variance is higher than the training variance.

A good test to check if a variance is greater than another one is the F-test, but it only works with normally distributed residuals. If the distribution is not normal, the test might give wrong results.

So, if we really want to use this test, we must check the normality of the residuals using (for example) a Shapiro-Wilk test.

How To Measure The Goodness Of A Regression Model

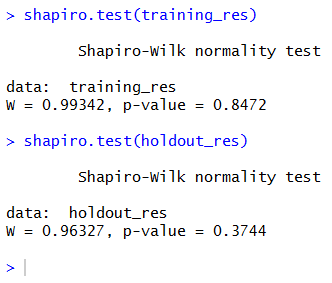
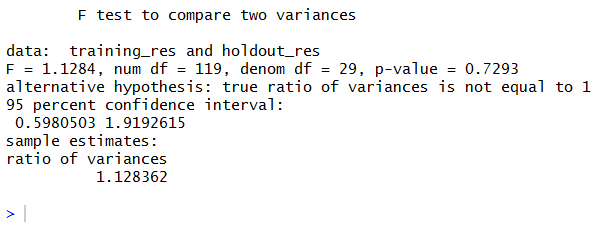
Both p-values are higher than 5%, so we can say that both sets show normally distributed residuals. We can safely go on performing the F-test.

var.test(training_res,holdout_res)

How To Measure The Goodness Of A Regression Model

The p-value is 72%, which is greater than 5% and allows us to say that the two sets have the same variance.

Kolmogorov-Smirnov test

KS test is very general and useful for many situations. Generally speaking, we expect that, if our model works well, the probability distribution of the holdout residuals is similar to the probability distribution of the training residuals. The KS test has been created to compare probability distributions, so it can be used for this purpose. However, it carries some approximations that can be dangerous to our analysis. Significative differences between probability distributions can be hidden in the general considerations made by the test. Last, KS distribution is known only with some kind of approximation and, consequently, the p-value; so I suggest to use this test with care.

ks.test(training_res,holdout_res)

How To Measure The Goodness Of A Regression Model

Again, the large p-value can make us tell that the two distributions are the same.

Plot

A Professor of mine at the University usually said: “you have to look at data by your eyes”. In machine learning, it’s definitely true.

The best way to take a look at a regression data is by plotting the predicted values against the real values in the holdout set. In a perfect condition, we expect that the points lie on the 45 degrees line passing through the origin (y = x is the equation). The nearer the points to this line, the better the regression. If our data make a shapeless blob in the Cartesian plane, there is definitely something wrong.

plot(holdout$Sepal.Length,predict(m,holdout))
abline(0,1)
How To Measure The Goodness Of A Regression Model

Well, it could have been better, but it’s not completely wrong. Points lie approximatively on the straight line.

t-test on plot

Finally, we can calculate a linear regression line from the previous plot and check if its intercept is statistically different from zero and its slope is statistically different from 1. To perform these checks, we can use a simple linear model and the statistical theory behind the Student’s t-test.

Remember the definition of the t variable with n-1 degrees of freedom:

t-test on plot

When we use the summarize function of R on a linear model, it gives us the estimates of the parameters and their standard errors (i.e. the complete denominator of the t definition).

For the intercept, we have mu = 0, while the slope has mu = 1.

test_model = lm(real ~ predicted, data.frame(real=holdout$Sepal.Length,predicted=predict(m,holdout)))
s = summary(test_model)intercept =  s$coefficients[“(Intercept)”,”Estimate”]
intercept_error = s$coefficients[“(Intercept)”,”Std. Error”]
slope = s$coefficients[“predicted”,”Estimate”]
slope_error = s$coefficients[“predicted”,”Std. Error”]t_intercept = intercept/intercept_errort_slope = (slope-1)/slope_error


Now we have the t values, so we can perform a two-sided t-test in order to calculate the p-values.

Which method is the best one?

They are greater than 5% but not too high in absolute value.

Which method is the best one?

As usual, it depends on the problem. If the residuals are normally distributed, t-test and F-test are enough. If they are not, maybe a first plot can help us discover a macroscopic bias before using a Kolmogorov-Smirnov test.

However, non-normally distributed residuals should always raise an alarm in our head and make us search for some hidden phenomenon we haven’t considered yet.

Conclusions

In this short article, I’ve shown you some methods to calculate the goodness of a regression model. Though there are many possible ways to measure it, these simple techniques can be very useful in many situations and easily explainable to a non-technical audience.

  • Experfy Insights

    Top articles, research, podcasts, webinars and more delivered to you monthly.

  • Gianluca Malato

    Tags
    Machine Learning
    Leave a Comment
    Next Post
    Transformers are Graph Neural Networks

    Transformers are Graph Neural Networks

    Leave a Reply Cancel reply

    Your email address will not be published. Required fields are marked *

    More in AI & Machine Learning
    AI & Machine Learning,Future of Work
    AI’s Role in the Future of Work

    Artificial intelligence is shaping the future of work around the world in virtually every field. The role AI will play in employment in the years ahead is dynamic and collaborative. Rather than eliminating jobs altogether, AI will augment the capabilities and resources of employees and businesses, allowing them to do more with less. In more

    5 MINUTES READ Continue Reading »
    AI & Machine Learning
    How Can AI Help Improve Legal Services Delivery?

    Everybody is discussing Artificial Intelligence (AI) and machine learning, and some legal professionals are already leveraging these technological capabilities.  AI is not the future expectation; it is the present reality.  Aside from law, AI is widely used in various fields such as transportation and manufacturing, education, employment, defense, health care, business intelligence, robotics, and so

    5 MINUTES READ Continue Reading »
    AI & Machine Learning
    5 AI Applications Changing the Energy Industry

    The energy industry faces some significant challenges, but AI applications could help. Increasing demand, population expansion, and climate change necessitate creative solutions that could fundamentally alter how businesses generate and utilize electricity. Industry researchers looking for ways to solve these problems have turned to data and new data-processing technology. Artificial intelligence, in particular — and

    3 MINUTES READ Continue Reading »

    About Us

    Incubated in Harvard Innovation Lab, Experfy specializes in pipelining and deploying the world's best AI and engineering talent at breakneck speed, with exceptional focus on quality and compliance. Enterprises and governments also leverage our award-winning SaaS platform to build their own customized future of work solutions such as talent clouds.

    Join Us At

    Contact Us

    1700 West Park Drive, Suite 190
    Westborough, MA 01581

    Email: support@experfy.com

    Toll Free: (844) EXPERFY or
    (844) 397-3739

    © 2023, Experfy Inc. All rights reserved.